16.7. Induction tubes#
| Author: | Norbert van Veen |
| Time: | 10-20 minutes |
| Age group: | 14 - 18 |
| Concepts: | Induction, magnets, Lenz |
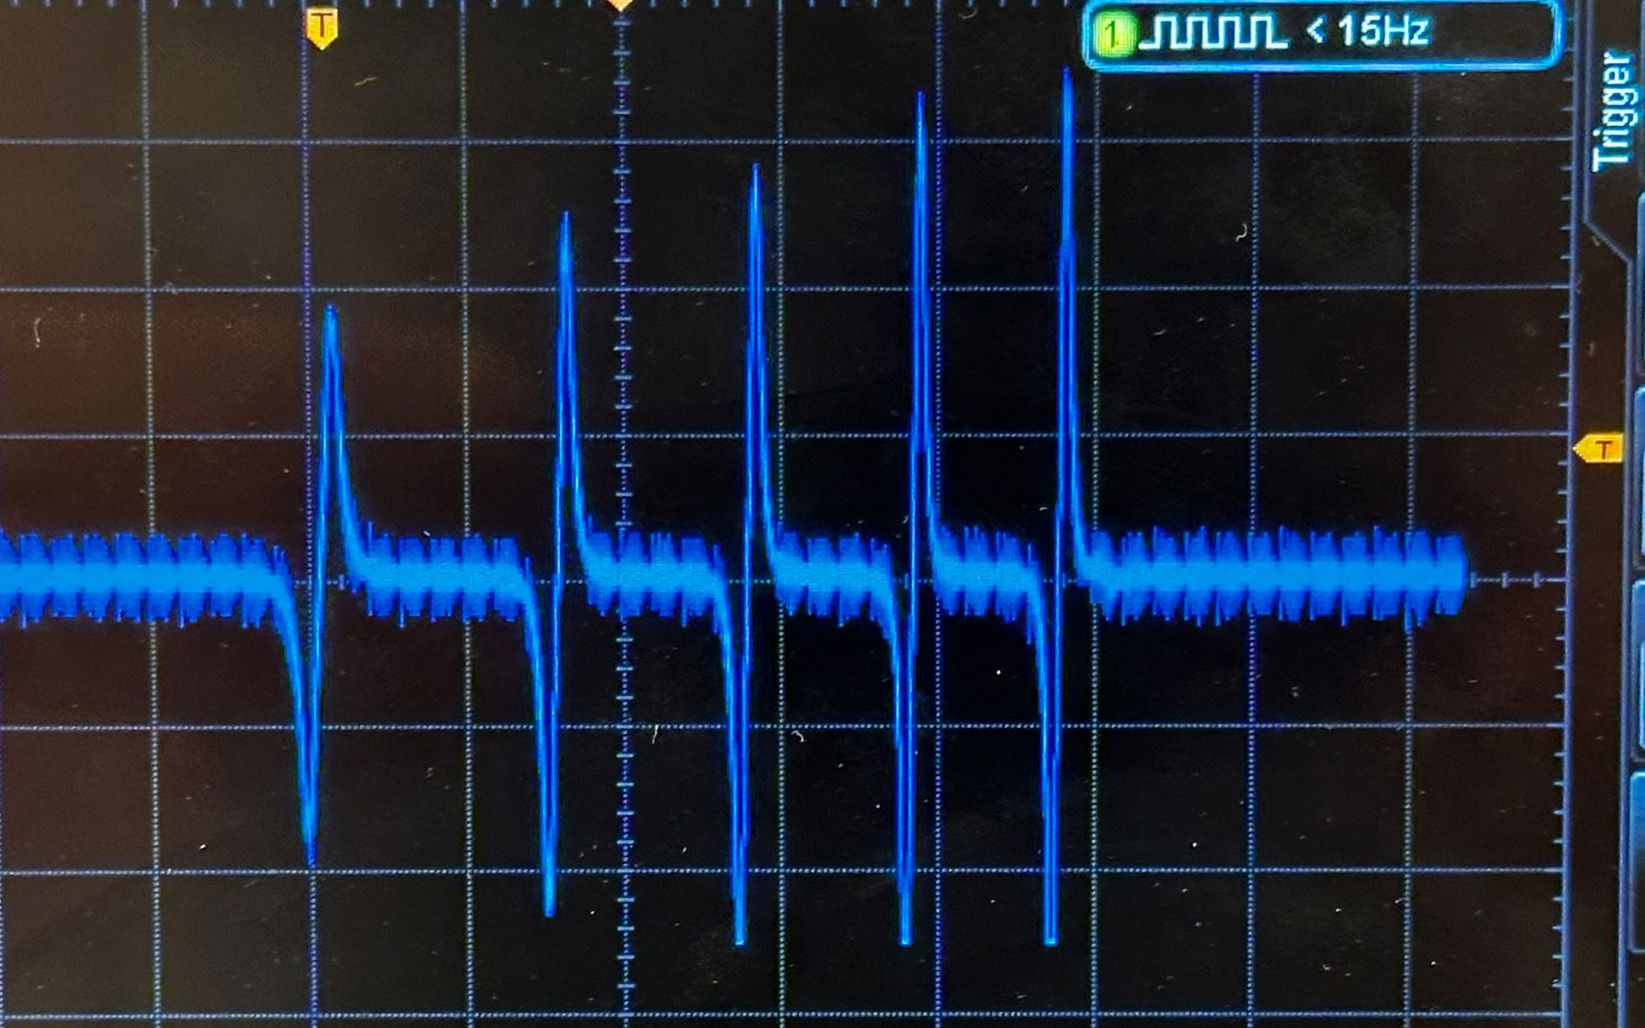
Fig. 16.18 Measurement of the induced voltage using an oscilloscope.#
Introduction#
A magnet falling through a coil generates an induced voltage. In this demonstration, we observe a magnet falling through a plastic tube and an aluminum tube. Both tubes have the same number of identical coils arranged at equal intervals along the tube. We examine the measured induced voltage over time.
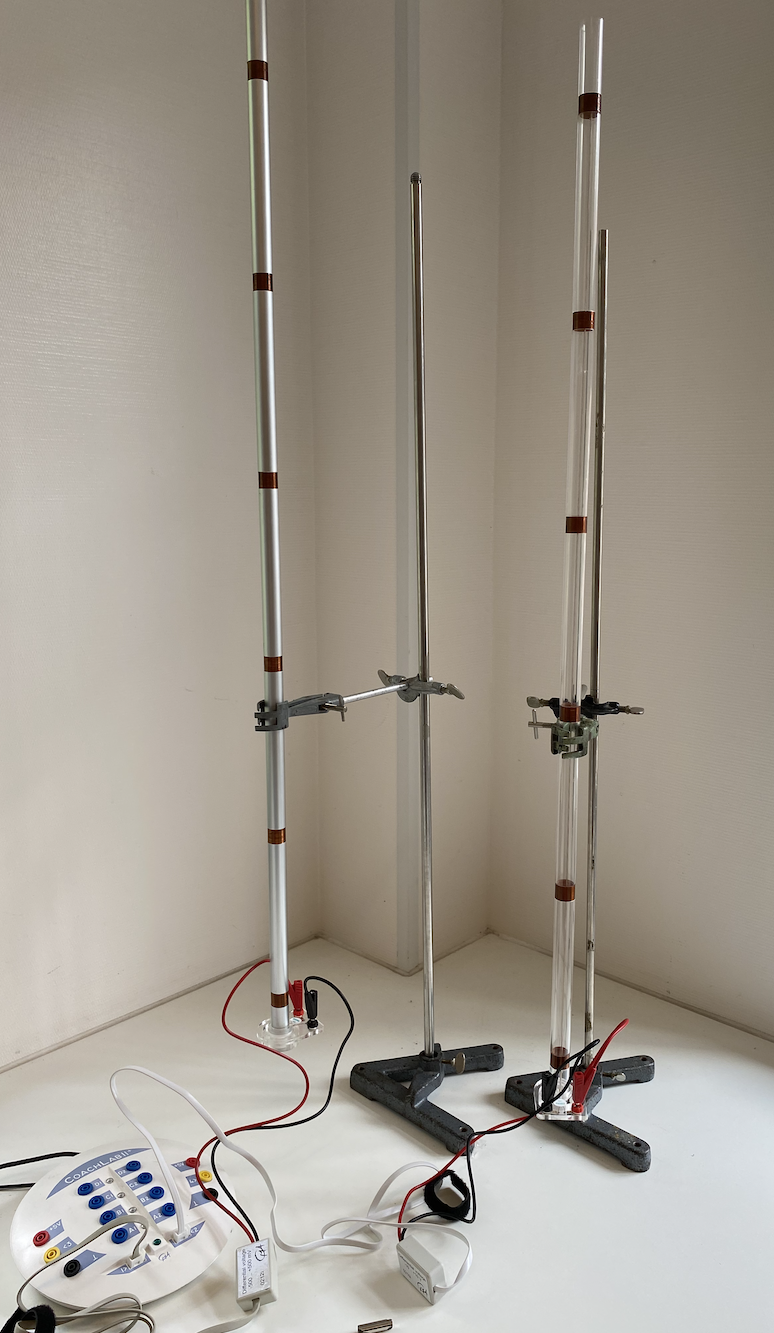
Fig. 16.19 Setup with the aluminum tube on the left and the plastic tube on the right#
Equipment#
Plastic tube and aluminum tube each with at least three identical coils evenly spaced around them
Measurement device and software, or oscilloscope
Voltage sensor (\(\pm\) 500 mV and \(\pm\) 10 V)
Stands
Bar magnet
Soft surface beneath the tube.
Preparation#
Secure the tubes in the stands. Position the tubes perfectly vertically. Connect a voltage sensor (\(\pm\) 10 V) to the coils around the plastic tube. Connect the sensor to your measurement device or oscilloscope. Set a trigger so that the measurement start when the magnet passes the first coil. For the aluminum tube, a voltage sensor (\(\pm\) 500 mV) is more suitable. Set the voltage sensor to 0 V.
For the measurements of Figure 16.20, we used a sample rate of 1000 measurements per second, a trigger time of 0.1 s (trigger on the voltage sensor at 100 mV) and ran the measurement for a maximum of 1 s.
Procedure#
Move a magnet through a coil and demonstrate that it generates a voltage. (Sketch the graph of one movement of a magnet through a coil on the board.)
Let the magnet fall through the plastic tube.
Display the (\(U\),\(t\)) diagram of the magnet falling through the plastic tube (see Figure 16.20).
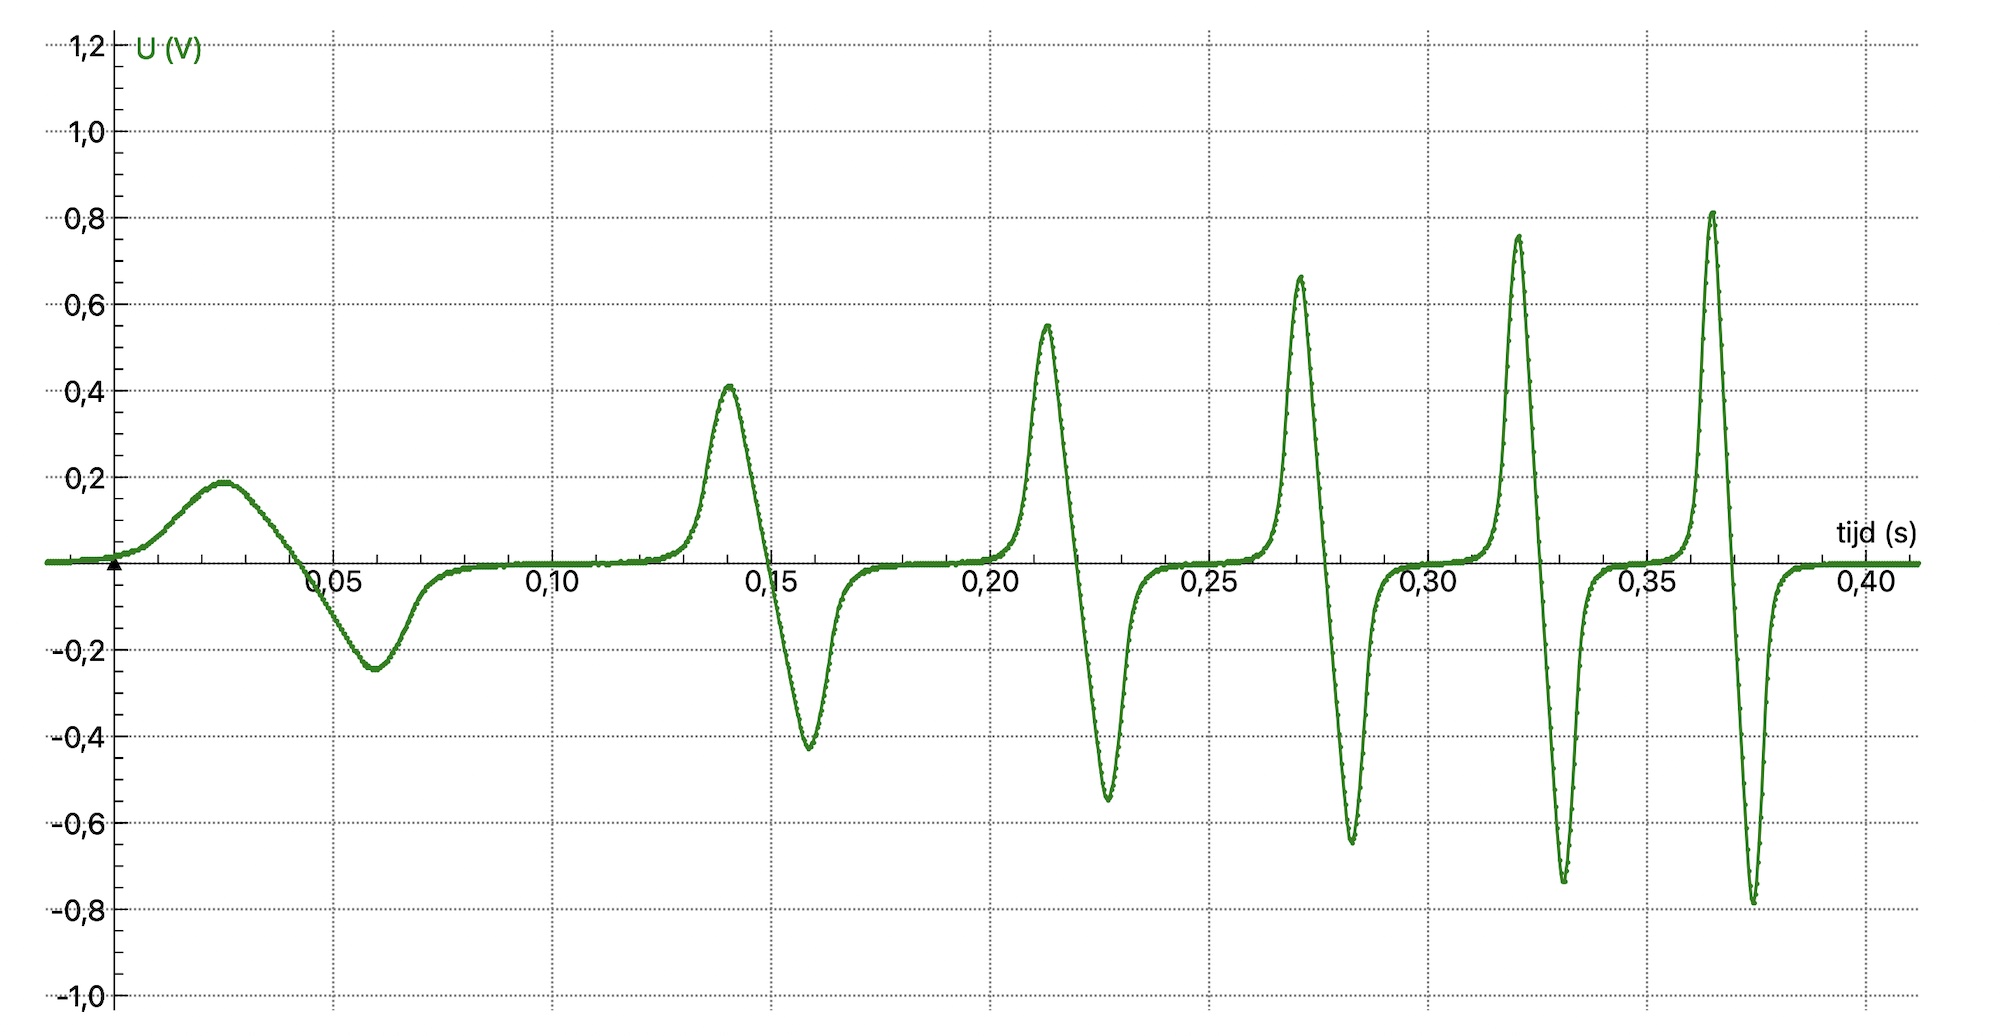
Fig. 16.20 Each of the six coils of the plastic tube produces a signal as the falling magnet passes. The differences between the graphs per coil allow for discussion.#
How do the six graphs compare to each other? Provide an explanation for the similarities and difference.
Use the area determination under the Analysis/Processing option to show that the area under each peak of the coil graph gives the same value. The area value of such a peak is also equal to the area under a trough, see Figure 16.21.
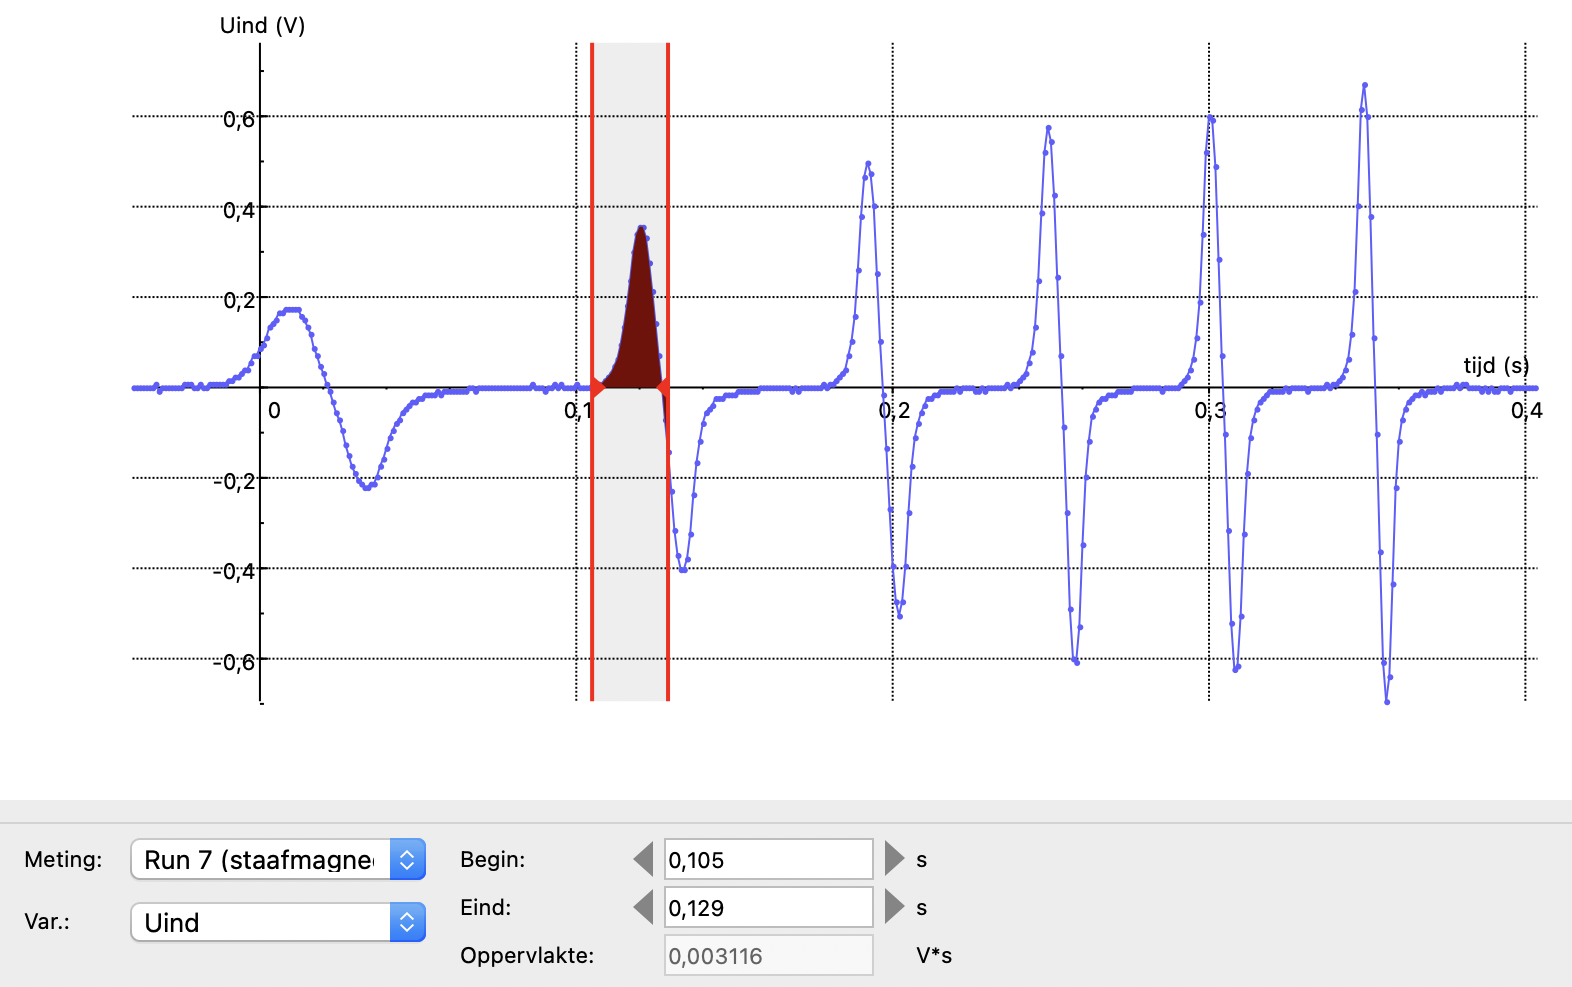
Fig. 16.21 Most measurement software allow you to determine the value of the area in \(V_s\).#
Why should this area be equal?
Repeat the experiment with the aluminum tube.
A question to assess students’ understanding: What do you expect from the graph that will be measured?
Physics background#
An approaching magnetic field induces a current in a coil so that the magnetic field induced by the coil opposes that of the approaching magnet (Lenz’s Law). The coil creates an attracting magnetic field when the magnet moves away from the coil. Thus, the direction of the current in the coil windings changes.
As the magnet falls and accelerates, the velocity at each coil will differ, a low average velocity at the first coil and a high average velocity at the last coil. In the plastic tube, an opposing magnetic field is induced only at near the six coils. In the aluminum tube, however, the magnet will “feel” the opposing magnetic fields throughout its entire fall.
The induced voltage can be calculated using Faraday’s law: \(U_{ind}=N\frac{\Delta \phi}{\Delta t}\) and thus: \(U_{ind}\Delta t=N\Delta \phi\)
Because the product of \(N·ΔΦ\) is constant (the number of turns per coil is equal and also the magnet strength and the area of the coils), the product must also be equal. This product is the area under the graphs. As the magnet falls faster, the induced voltage increases and the time interval \(\Delta t\) becomes smaller.
Tip
The experiment is also feasible with only three coils per tube.
If you take the absolute value of \(U_{ind}\), then the change in \(U_{ind}\) over time can be seen with only positive peaks. Then the increase in falling speed is clearly visible. You can potentially use this to determine the acceleration due to gravity.
Follow-up#
The demonstration Does the magnet challenge gravity? provides a suitable follow up.