15.11. Ranking the ‘stars’#
| Author: | Wouter Spaan |
| Time: | 30-40 minutes |
| Age group: | 15 - 18 |
| Concepts: | Observing, luminosity, stars, measurement |
Introduction#
In this activity, astronomical observations are simulated in the classroom. By observing light bulbs using various methods, the goal is to make students understand how to obtain temperature information from stars. This method can also lead to information about the luminosity of a star and therefore to information about their distance to the observer. Using thinking-back-and-forth student can infer such ‘conclusions’ themselves.
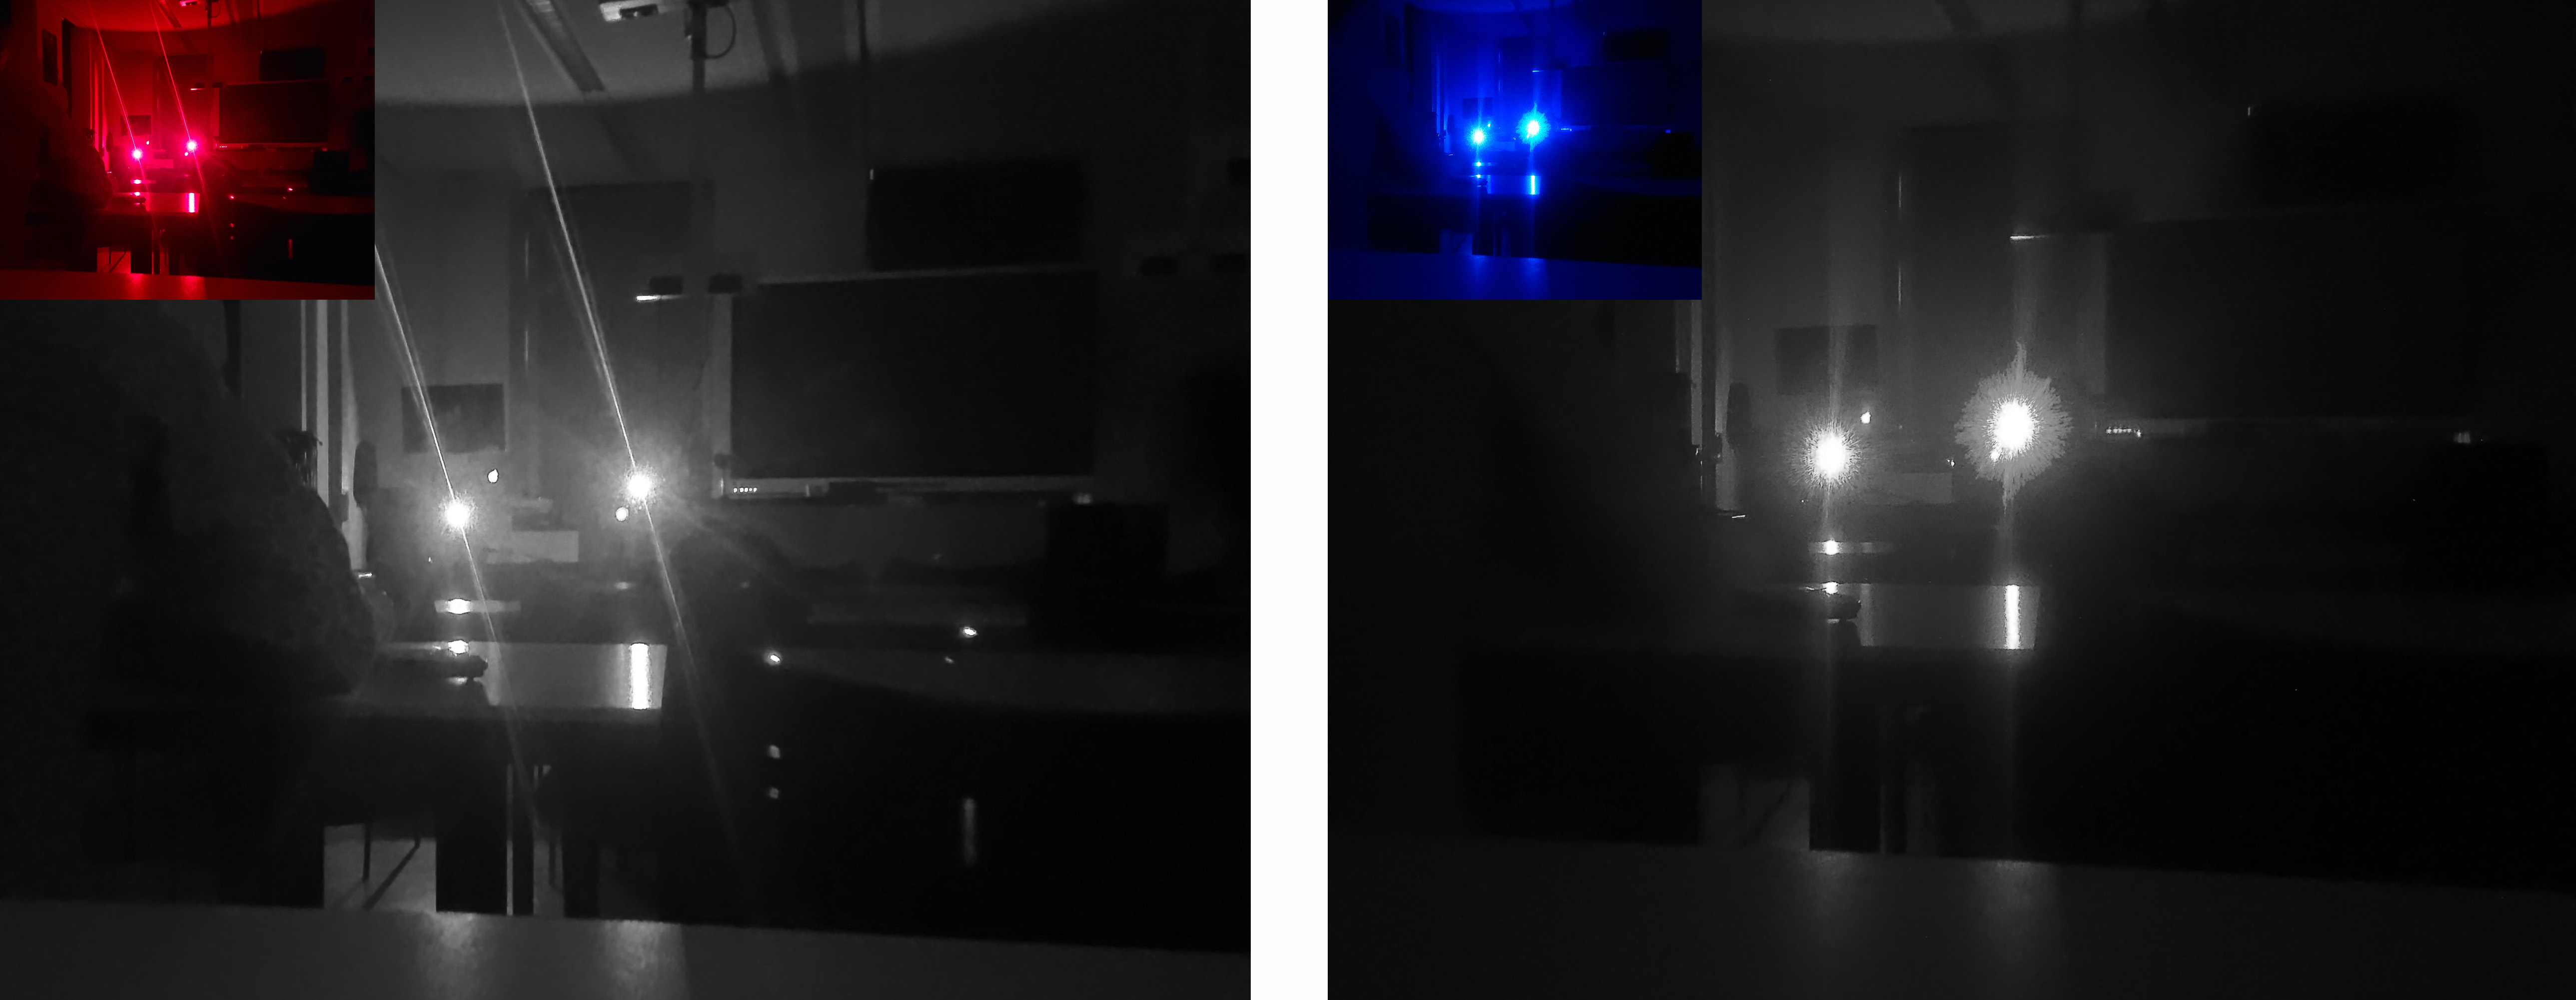
Fig. 15.28 The demonstration investigates ‘distance’ stars by comparing the brightness of light bulbs through filters.
left: The two light bulbs photographed through a red filter held in front of the camera. The inset shows the original color image.
right: The same two light bulbs now photographed through a blue filter held in front of the camera.#
Equipment#
Two identical light bulbs that you can operate at different voltages, for example, using a dimmer;
a set of simple red filters;
a set of blue filters;
smartphones.
Note: in astronomy, a filter is named after the wavelength it transmits. So, a red filter allows red light to pass through and absorbs other wavelengths. This is different from photography.
Preparation#
Prepare a number of identical light bulbs in advance which serve as distant ‘stars’. Make sure to vary their brightness by operating the bulbs at different voltages. We used (6V,30W) light bulbs, where one bulb is set at 6 V and the other at 4 V. The light bulbs must be identical because the surface area of the filament must be the same. Position the bulbs at different distances from the observer so that they appear equally bright for that observer at the other end of the classroom (or long corridor or hallway). Dimming the lights enhances the atmosphere, but is not crucial for the experiment.
Procedure#
Introduce the bulbs as interesting distant ‘stars’. Tell the students that they will take measurements from these and ought to (qualitatively) determine their temperature and distance. You can emphasize that, initially, this seems very easy to do because one can see which is nearer (due to information of the environment, such as chairs and tables) and which is brighter. However, in astronomy this information is not present and yet we know a lot of stars… Therefore, the students will perform the ‘measurements’ with the information an astronomer has when observing: black and white photos showing only the bulbs; they are not allowed to use any information about the surroundings (tables, walls, etc.) visible in the photographs. What they can use are a set of color filters and their own smartphone camera (set to black and white if possible). The assignment then becomes: Determine which of these bulbs has the highest temperature and which one is closest using your mobile phone camera and the color filters without using any other information. There is value in having students first think and discuss what they can do before using the filters.
Although the solution of which photos to take is simple, providing a coherent and complete reasoning is significantly more difficult. You need to photograph both bulbs once through a red filter and once through a blue filter with exactly the same settings. Next, you have to compare these images in order to answer the questions about temperature and distance.
During the debriefing, you can ask probing questions so that students have to think back and forth firmly, ensuring they understand how to interpret observations using Wien’s Displacement Law and Stefan-Boltzmann Law. To support their reasoning, you can show a diagram of spectra from black bodies, see Figure 15.29. This helps to extract the temperature from the observations and helps to convey the idea that an object (star) with a higher temperature emits more power in all wavelength ranges.
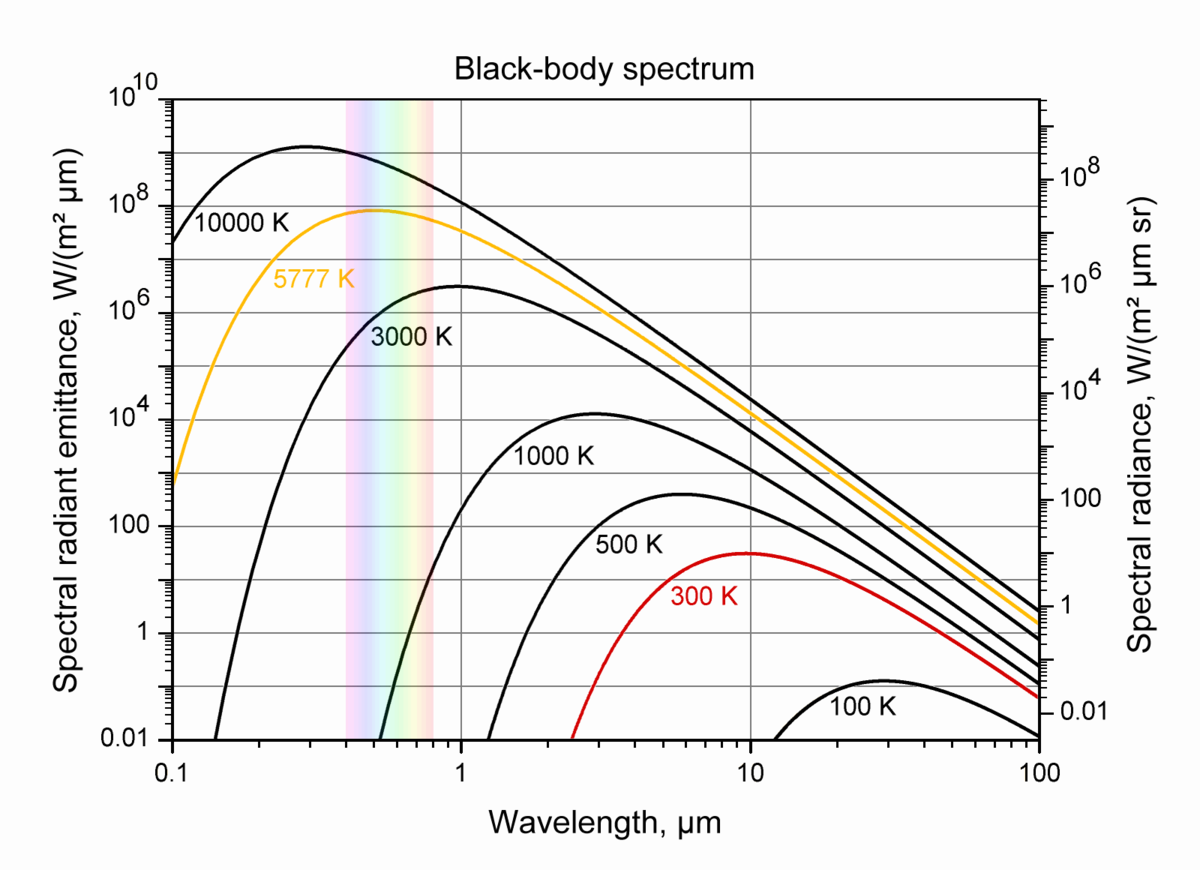
Fig. 15.29 Black body spectrum, figure taken from https://commons.wikimedia.org/wiki/File:BlackbodySpectrum_loglog_en.svg (public domain).#
Physics background#
The lamp with the highest temperature will emit shorter wavelengths (Wien’s Displacement Law) and therefore will be brightest when using the blue filter (in the images, this is the lamp at the right), while there will be little to no difference when using the red filter. It follows that the relatively bluest lamp has the highest temperature. Because a higher temperature leads to higher emitted power (Stefan-Boltzmann Law) and both lamps appear approximately equally bright, the lamp with the highest temperature is the farthest away. In the images above, the lamp at the left is therefore nearest to the observer. This can only be known if you know that the surface area of the filament is the same, which is a correct assumption for identical light bulbs. However, this comparison is not valid for real stars, so the analogy breaks down, an aspect to emphasize during the central discussion.
This reasoning involves various thinking-back-and-forth steps to connect observations to conclusions. There is a double comparison: in one of the two filters, there should be no (or very little) difference between the stars (in the images above, this is the red filter), and in the other filter, there should be a clear difference visible. Only then can you say something about the color and thus about the temperature. If the same bulb is brighter in both filters, unfortunately, this provides no useful information for answering our questions unless we resort to quantitative measurements (which astronomers can do very well). The inference towards distance requires a subtle comparison as well because it is essential here too that both bulbs appear approximately equally bright.
In astronomy, blue and green filters are usually used for color information. However, with the green filters available to the author, the difference appeared to be too small for any of these inferences.
Tip
This activity does not work with every mobile phone. Some cameras seem to adjust too much on their own and do not keep the settings constant. Setting it to fully manual mode, increasing the ISO value, and closing the aperture sometimes appears to provide a solution. Having students work together in groups can reduce the problem.
You can share students’ photos using a project. In any case, make sure to have two usable photos available yourself!
Wikipedia provides information about the relationship between color index and temperature.