15.12. Singing rod#
Tones, overtones, waves and vibrations
| Author: | Ad Mooldijk & Norbert van Veen |
| Time: | 10 minutes |
| Age group: | 14 - 18 |
| Concepts: | Sound, fundamental frequency, overtones, Young's modulus |
Introduction#
This demonstration consists of two parts. In both parts you demonstrate the eigenfrequency of a system and, by choosing the correct positions on the rod, you can demonstrate overtones. Frequency measurements are straightforward, and the link to the physics of musical instruments is quickly established.
In the second part, if executed properly, a lot of noise at an irritating pitch is generated; it is a demonstration that students will certainly not forget.
Equipment#
Measuring tape
Aluminum or brass rod(s) (various lengths)
Fine sandpaper and/or a hammer
Felt-tip pen or pencil
Sound sensor with appropriate software or phyphox app (Audio spectrum)
Preparation#
For the first part of the demonstration, test beforehand where to tap the rod and hold it in various places to get an idea of how it sounds. Optionally, try another rod made of different material.
For the second part: mark the middle and a quarter length from the top of the rod with a dash. Ensure you can measure for a short time with a high measurement frequency. Practice beforehand how to achieve a higher sound level. Find the right pace to rub the rod with sandpaper, do not press it down too hard to obtain resonance.
Procedure#
Part 1#
Hold the rod in the middle and let it resonate by tapping it sideways against a table as in Figure 15.30
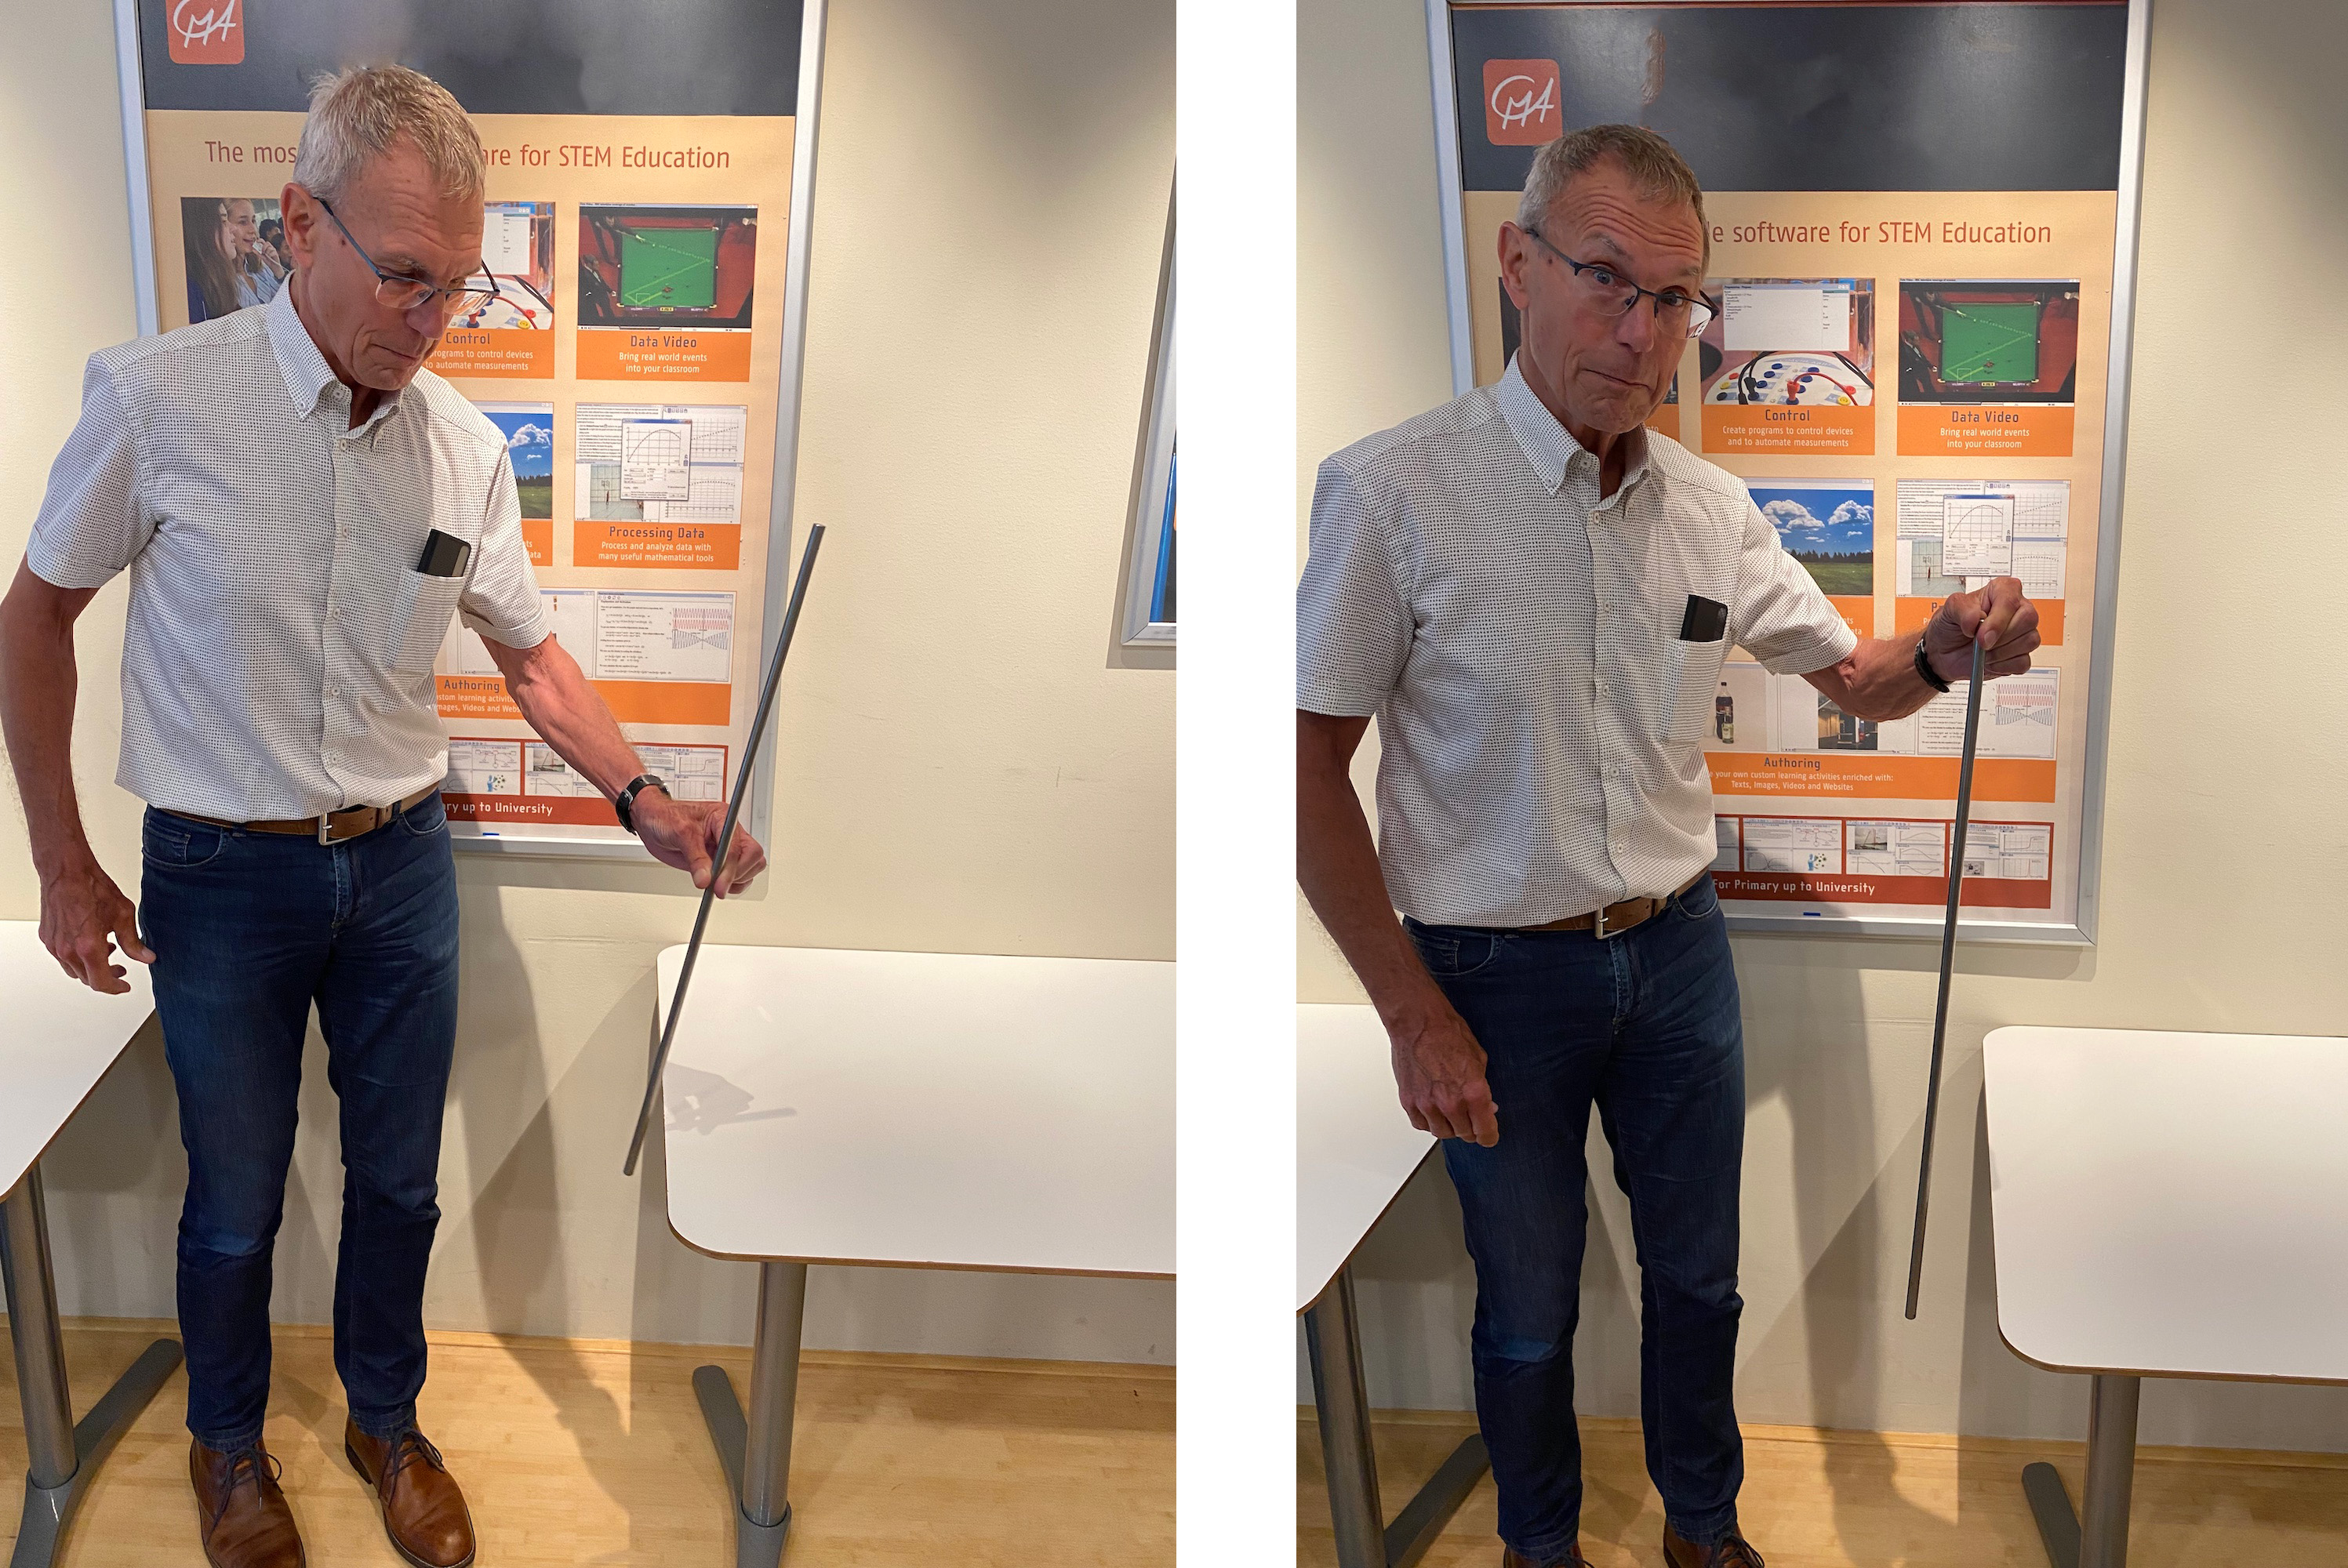
Fig. 15.30 The frequency produced depends on the point where you hold the rod.\
Left: Holding the rod in the middle and tapping it against a table or striking it in another way produces a nice sound.
Right: If you hold the rod at the end, you only hear a dull thud. The rod does not resonate.#
What do you think will influence the frequency?
Then hold the rod a quarter from the top.
Can you predict whether you will hear a higher, lower, or the same tone now? (Predict-Explain-Observe-Explain)
In a class discussion, the intention is for students to understand that this relates to nodes and antinodes and overtones.
Choose other places to hold the rod.
To check students’ understanding, you can ask: What will you hear if you hold the rod at one of the ends and let it resonate?
Part 2#
Hold the rod loosely in the middle. Rub the fine sandpaper along the rod until the rod starts to ‘sing’. By rubbing at the right pace, you can achieve a reasonable sound level. A short tap with a hammer on one end of the rod (lengthwise) also produces a nice tone.
Turn the rod around, pointing its tip towards students, and ask them where the sound of the rod is coming from exactly. Ask them also how you can stop the ‘singing’? Let the students think with that information about whether the vibration of the rod is longitudinal or transverse and how to determine this.
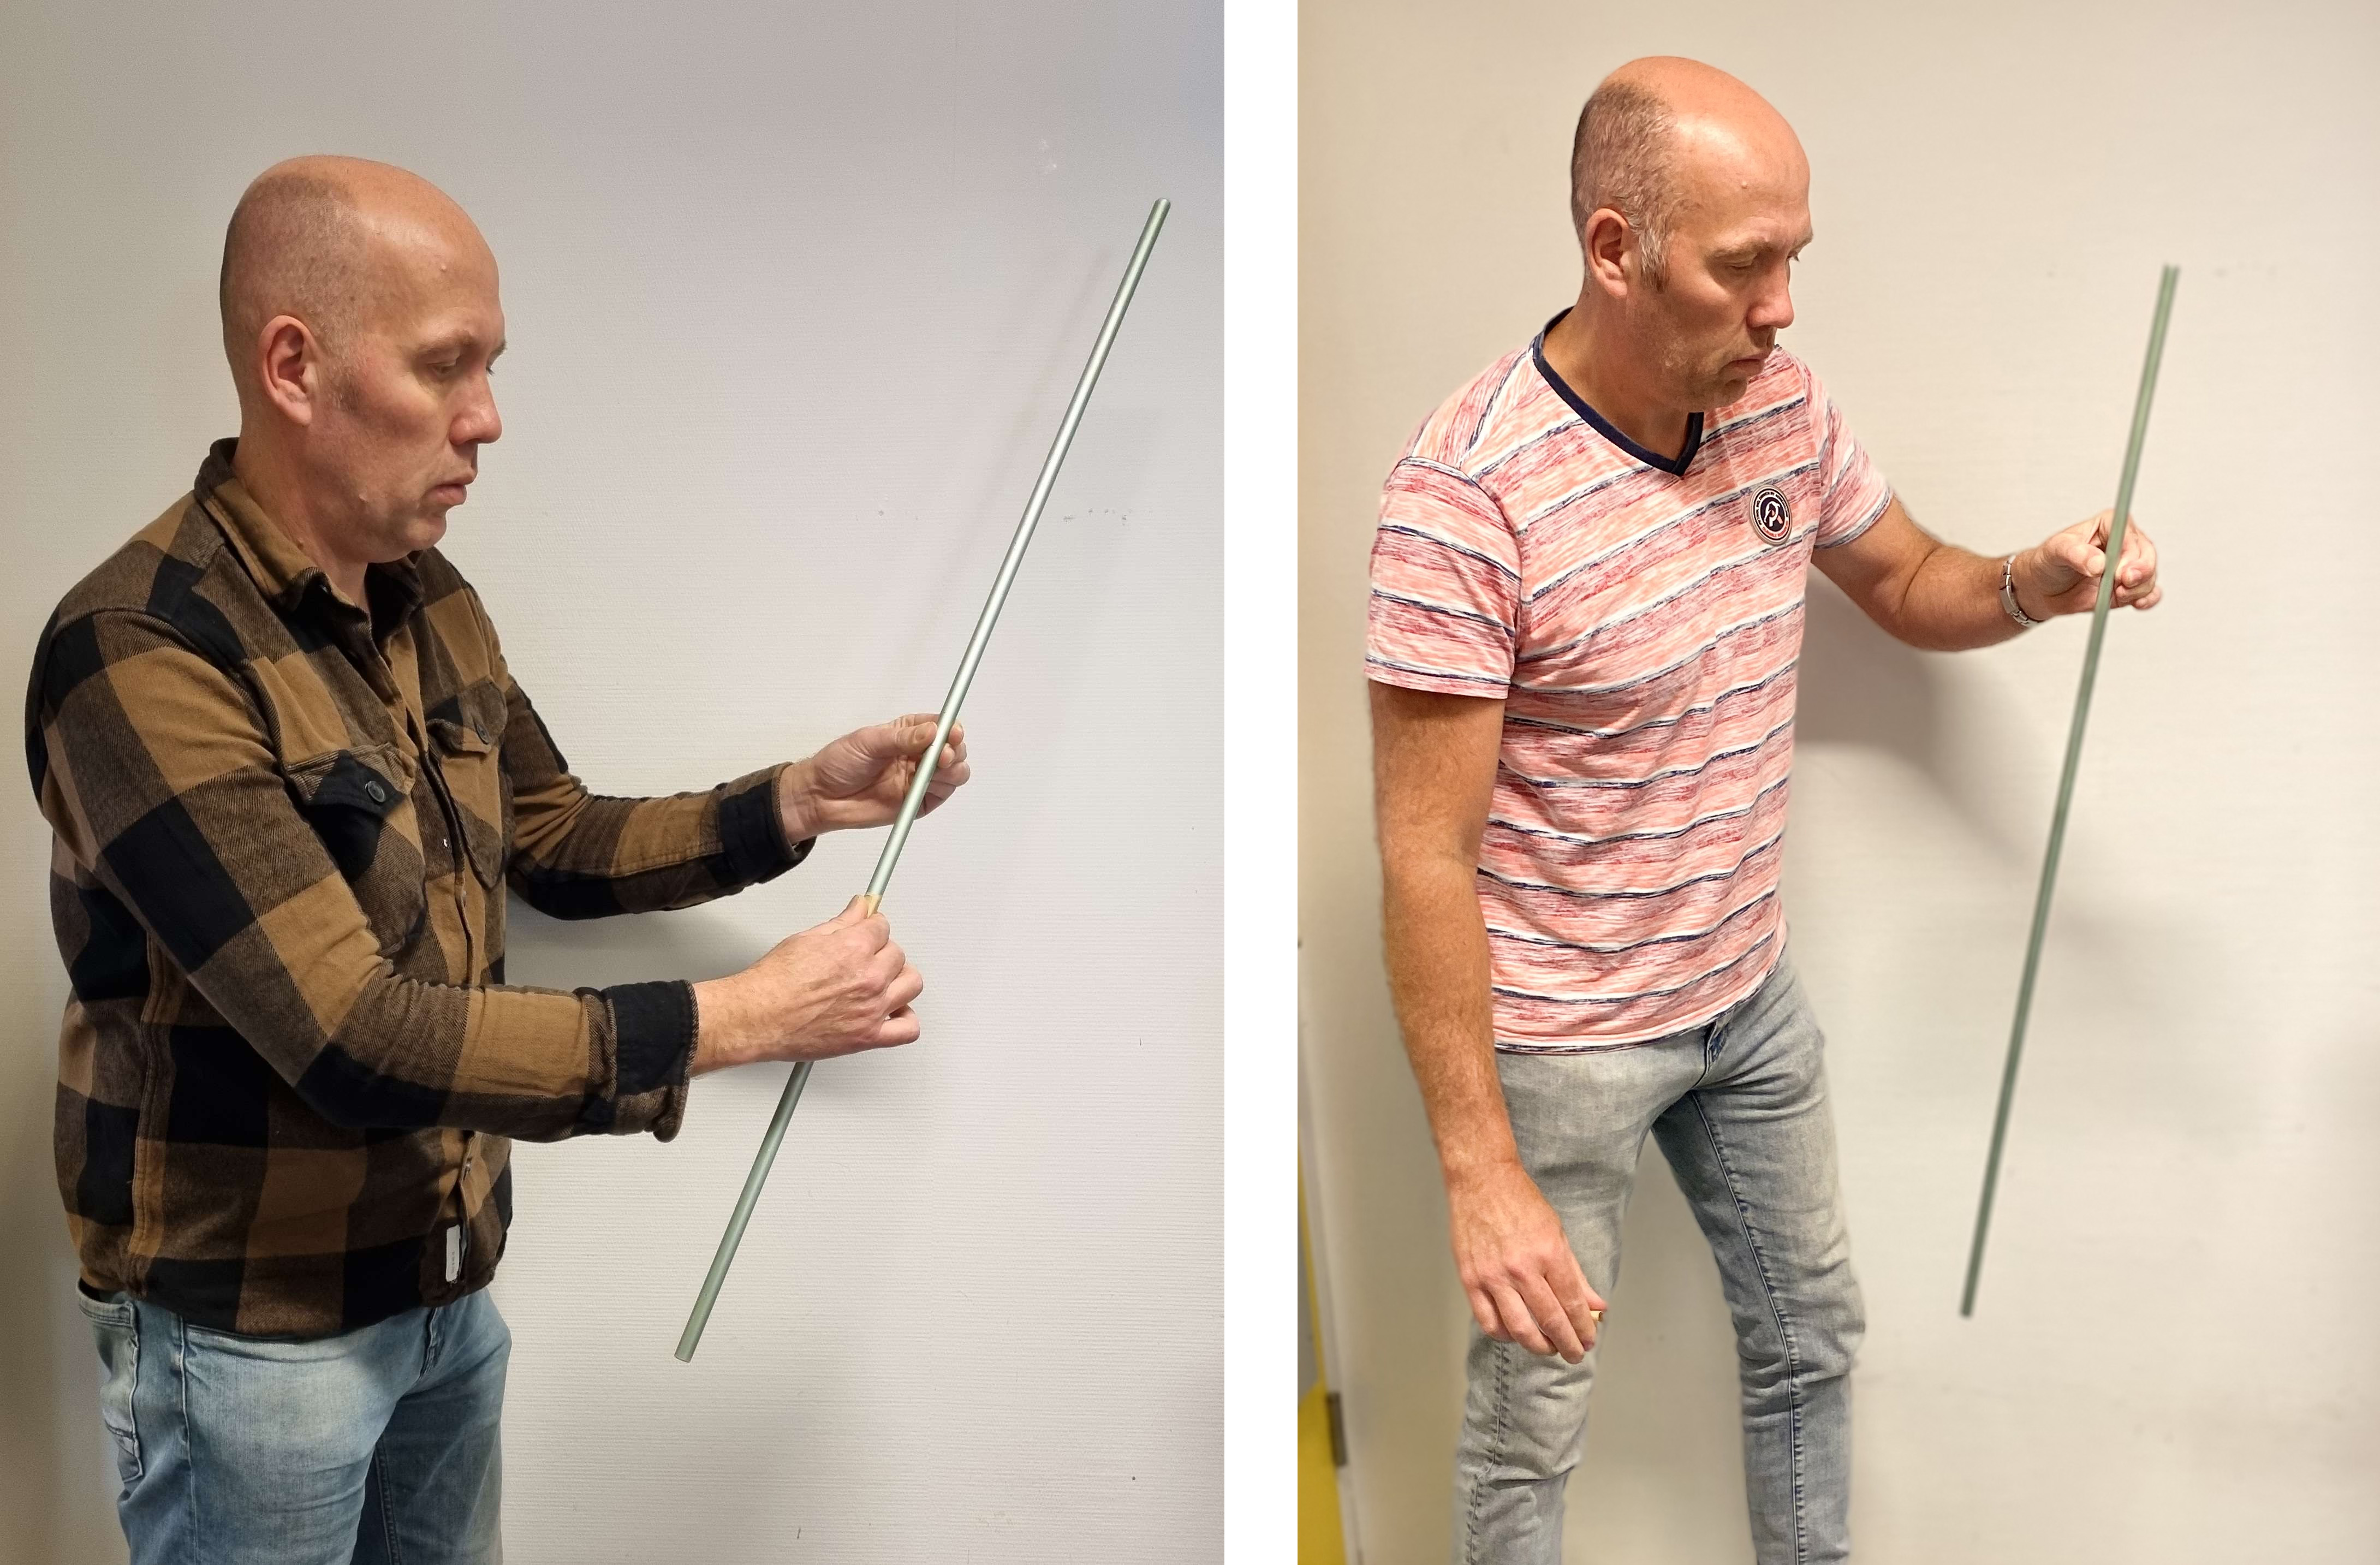
Fig. 15.31 Again, the frequency produced depends on the point where you hold the rod.\
Left: Hold the rod in the middle for the fundamental tone.
Right: Hold the rod a quarter length from the top for the first overtone.#
Loosely hold the rod a quarter from the top. Rub the fine sandpaper along the rod until the rod starts to ‘sing’. By rubbing at the right pace, a high sound level can be achieved again. (If rubbing does not work, then tap the rod with a hammer.)
How does this tone differ from the first tone you heard?
Why do you need to hold the rod in a different place to hear this tone?
Measure for the various tubes the frequency of the tones and determine the speed of sound in the rod (the rod is open ended on both sides). You can use the Python script below for analysing the data! Let the students sketch the vibration modes of the rod for the fundamental tone and overtone.
Note
An experienced demonstrator can even produce a second overtone. Where should you hold the rod then? Which tone do you dampen?
Physics background#
By striking the rod at one end (for example, against the table), vibrations with many different wavelengths are created in the rod. By holding the rod in the middle, a node is created there, allowing only waves with a node in the middle. Moreover, vibrations with a higher frequency dampen faster. Therefore, you clearly hear the fundamental frequency the best (Sometimes you have to wait for the overtones to die out).
By holding the rod a quarter length from the top, a vibration with a complete wavelength, thus resulting in a tone an octave higher, fits as the fundamental tone.
By rubbing with sandpaper, the rod vibrates both transversely and longitudinally. This can easily be demonstrated by making the rod ‘sing’ and then damping it. Longitudinal damping occurs by holding the rod at both ends, transversally by grasping the rod (encircling its width). The rod vibrates in both directions. For the fundamental tone, there is a node in the middle and a antinode at the ends. The wavelength is thus twice the length of the rod. The corresponding frequency can be calculated with:
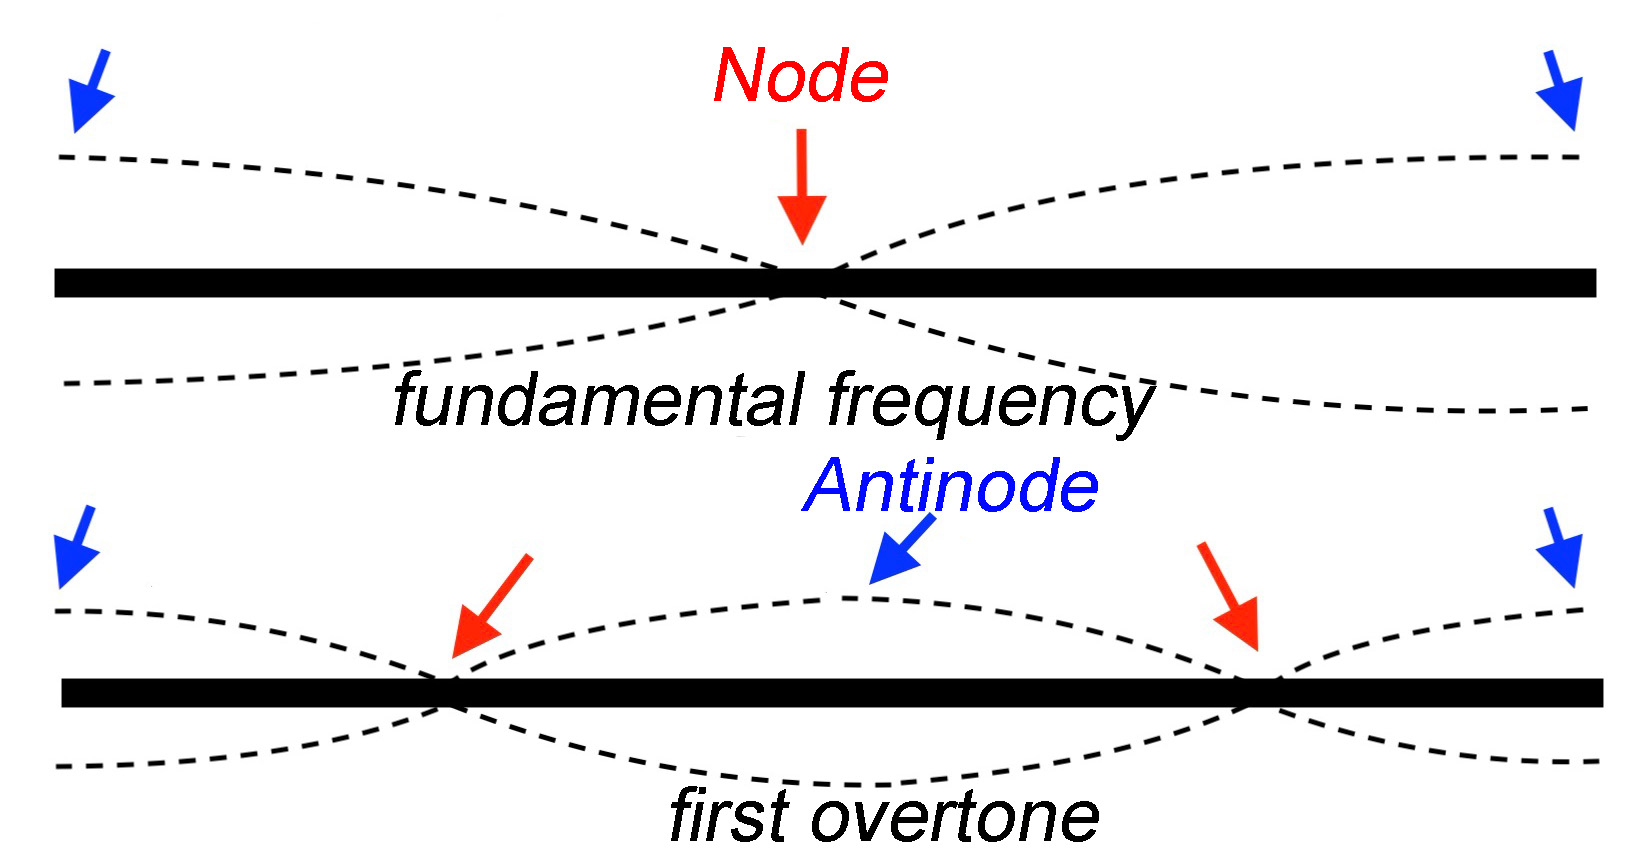
Fig. 15.32 The transversely drawn fundamental tone and the first overtone.#
The speed of sound in the rod can be calculated with:
Here, \(E\) is the elastic modulus of the material used (71 GPa for aluminum) and \(ρ\) is the density of the rod. Conversely, you can use the measured frequency to determine the elastic modulus of the material.
When ‘playing’ the overtone, the nodes are at a quarter and three-quarter length of the rod.
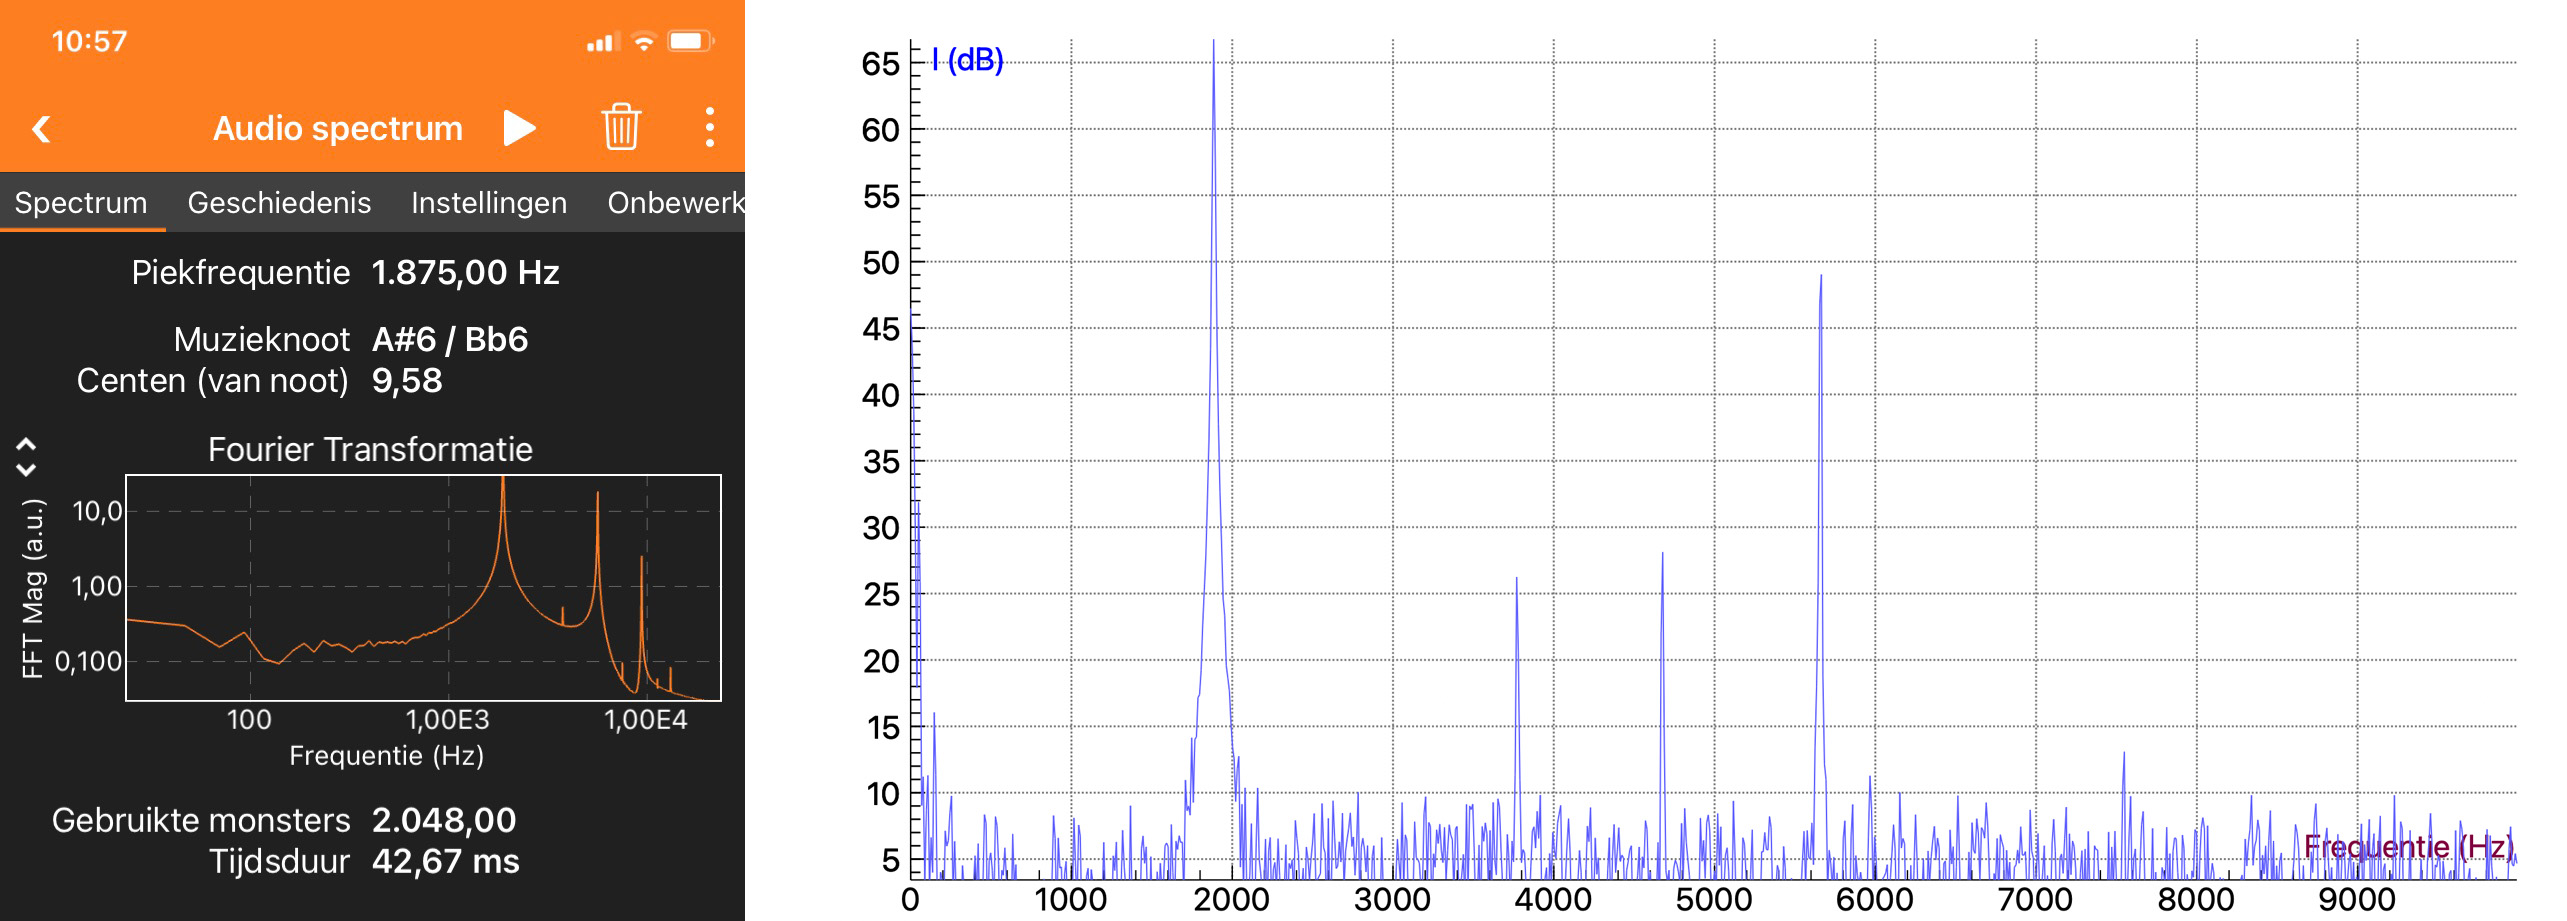
Fig. 15.33 Results of audio spectrum measurement with phyphox and Fourier analysis in Coach 7#
Tip
Do not hold the rod too tightly, as this will cause excessive damping.
It is important where you hold the rod: halfway or at a quarter. Rub the bottom of the rod in a short, quick motion. A hammer as a vibration source is handy if you have a rod with high density.
When ‘playing’ the fundamental tone, an analysis tool will also find the second overtone, but not the frequency of the first overtone (Figure 15.33). You can explain why this is with the help of Figure 15.32.
Use Coach 7 with a short time (≈ 2 s) and a measurement frequency of about 2 kHz to perform as accurate Fourier analysis as possible.
Phyphox (Audio spectrum) quickly provides a measured frequency. The higher overtones are visible, but the corresponding peak values cannot be read. Export the measurement from phyphox to Excel.
Python#
Freek Pols is using this experiment in his firstyear physics lab course. Rather than gently rubbing the rod, he uses a hammer to knock at one end of the rods.
He uses five brass and aluminium rods to determine Young’s modulus. The Python code is shown below, including his measurements for the aluminium rods. You can change these values.
# Loading the various libraries
import numpy as np
import matplotlib.pyplot as plt
from scipy.optimize import curve_fit

# The measurements
L = np.array([39.9, 60.0, 79.9, 99.8, 119.9])*1e-2 #m
f = np.array([6408, 4274,3209, 2562, 2137]) #Hz
rho_Al = 2.7e3 #kg/m^3


# fitfunction
def fitfunctie(L,a):
    return a/L

#fitten
var, cov = curve_fit(fitfunctie,f,L)

#test dataset die f uitrekent voor verschillende L
xtest = np.linspace(0.8*min(L),1.2*max(L),1000)
ytest = fitfunctie(xtest,var)

# Plotting the data and the fit
plt.figure()
plt.plot(L**2,1/f**2,'k.')
plt.plot(xtest**2,1/ytest**2,'r--')

# setting axes
plt.xlim(0.9*min(L**2),1.1*max(L**2))
plt.xlabel('$L^2$ (m$^2$)')
plt.ylabel('$f^{-2}$ (Hz$^{-2}$')

plt.show()

print('Young\'s modulus is', round(4*rho_Al*var[0]**2*1e-9), 'GPa')
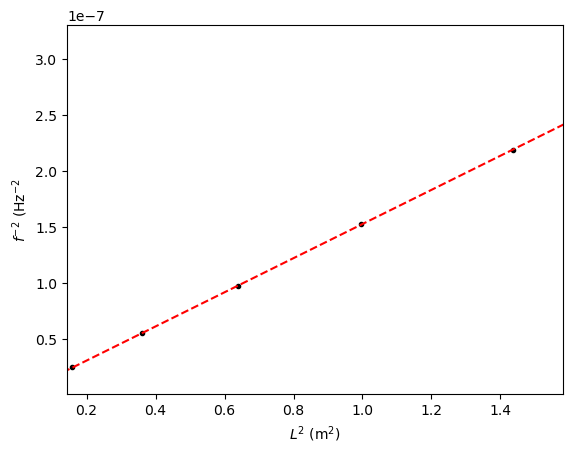
Young's modulus is 71 GPa