18.8. Condensation heat in infrared#
| Author: | Norbert van Veen |
| Time: | 10-30 minutes |
| Age group: | 14-18 |
| Concepts: | Condensation, evaporation |
Introduction#
In this demonstration, you make a nanoscale process visible in a simple way. Due to continuous evaporation, water in a cup has a lower temperature than the room its in, even after hours of being in that room. We monitor the temperature of a sheet of paper as evaporated water condenses on it. With the measured temperature rise, we estimate the number (layers) of water molecules needed for this increase. This demonstration is described in detail by [].

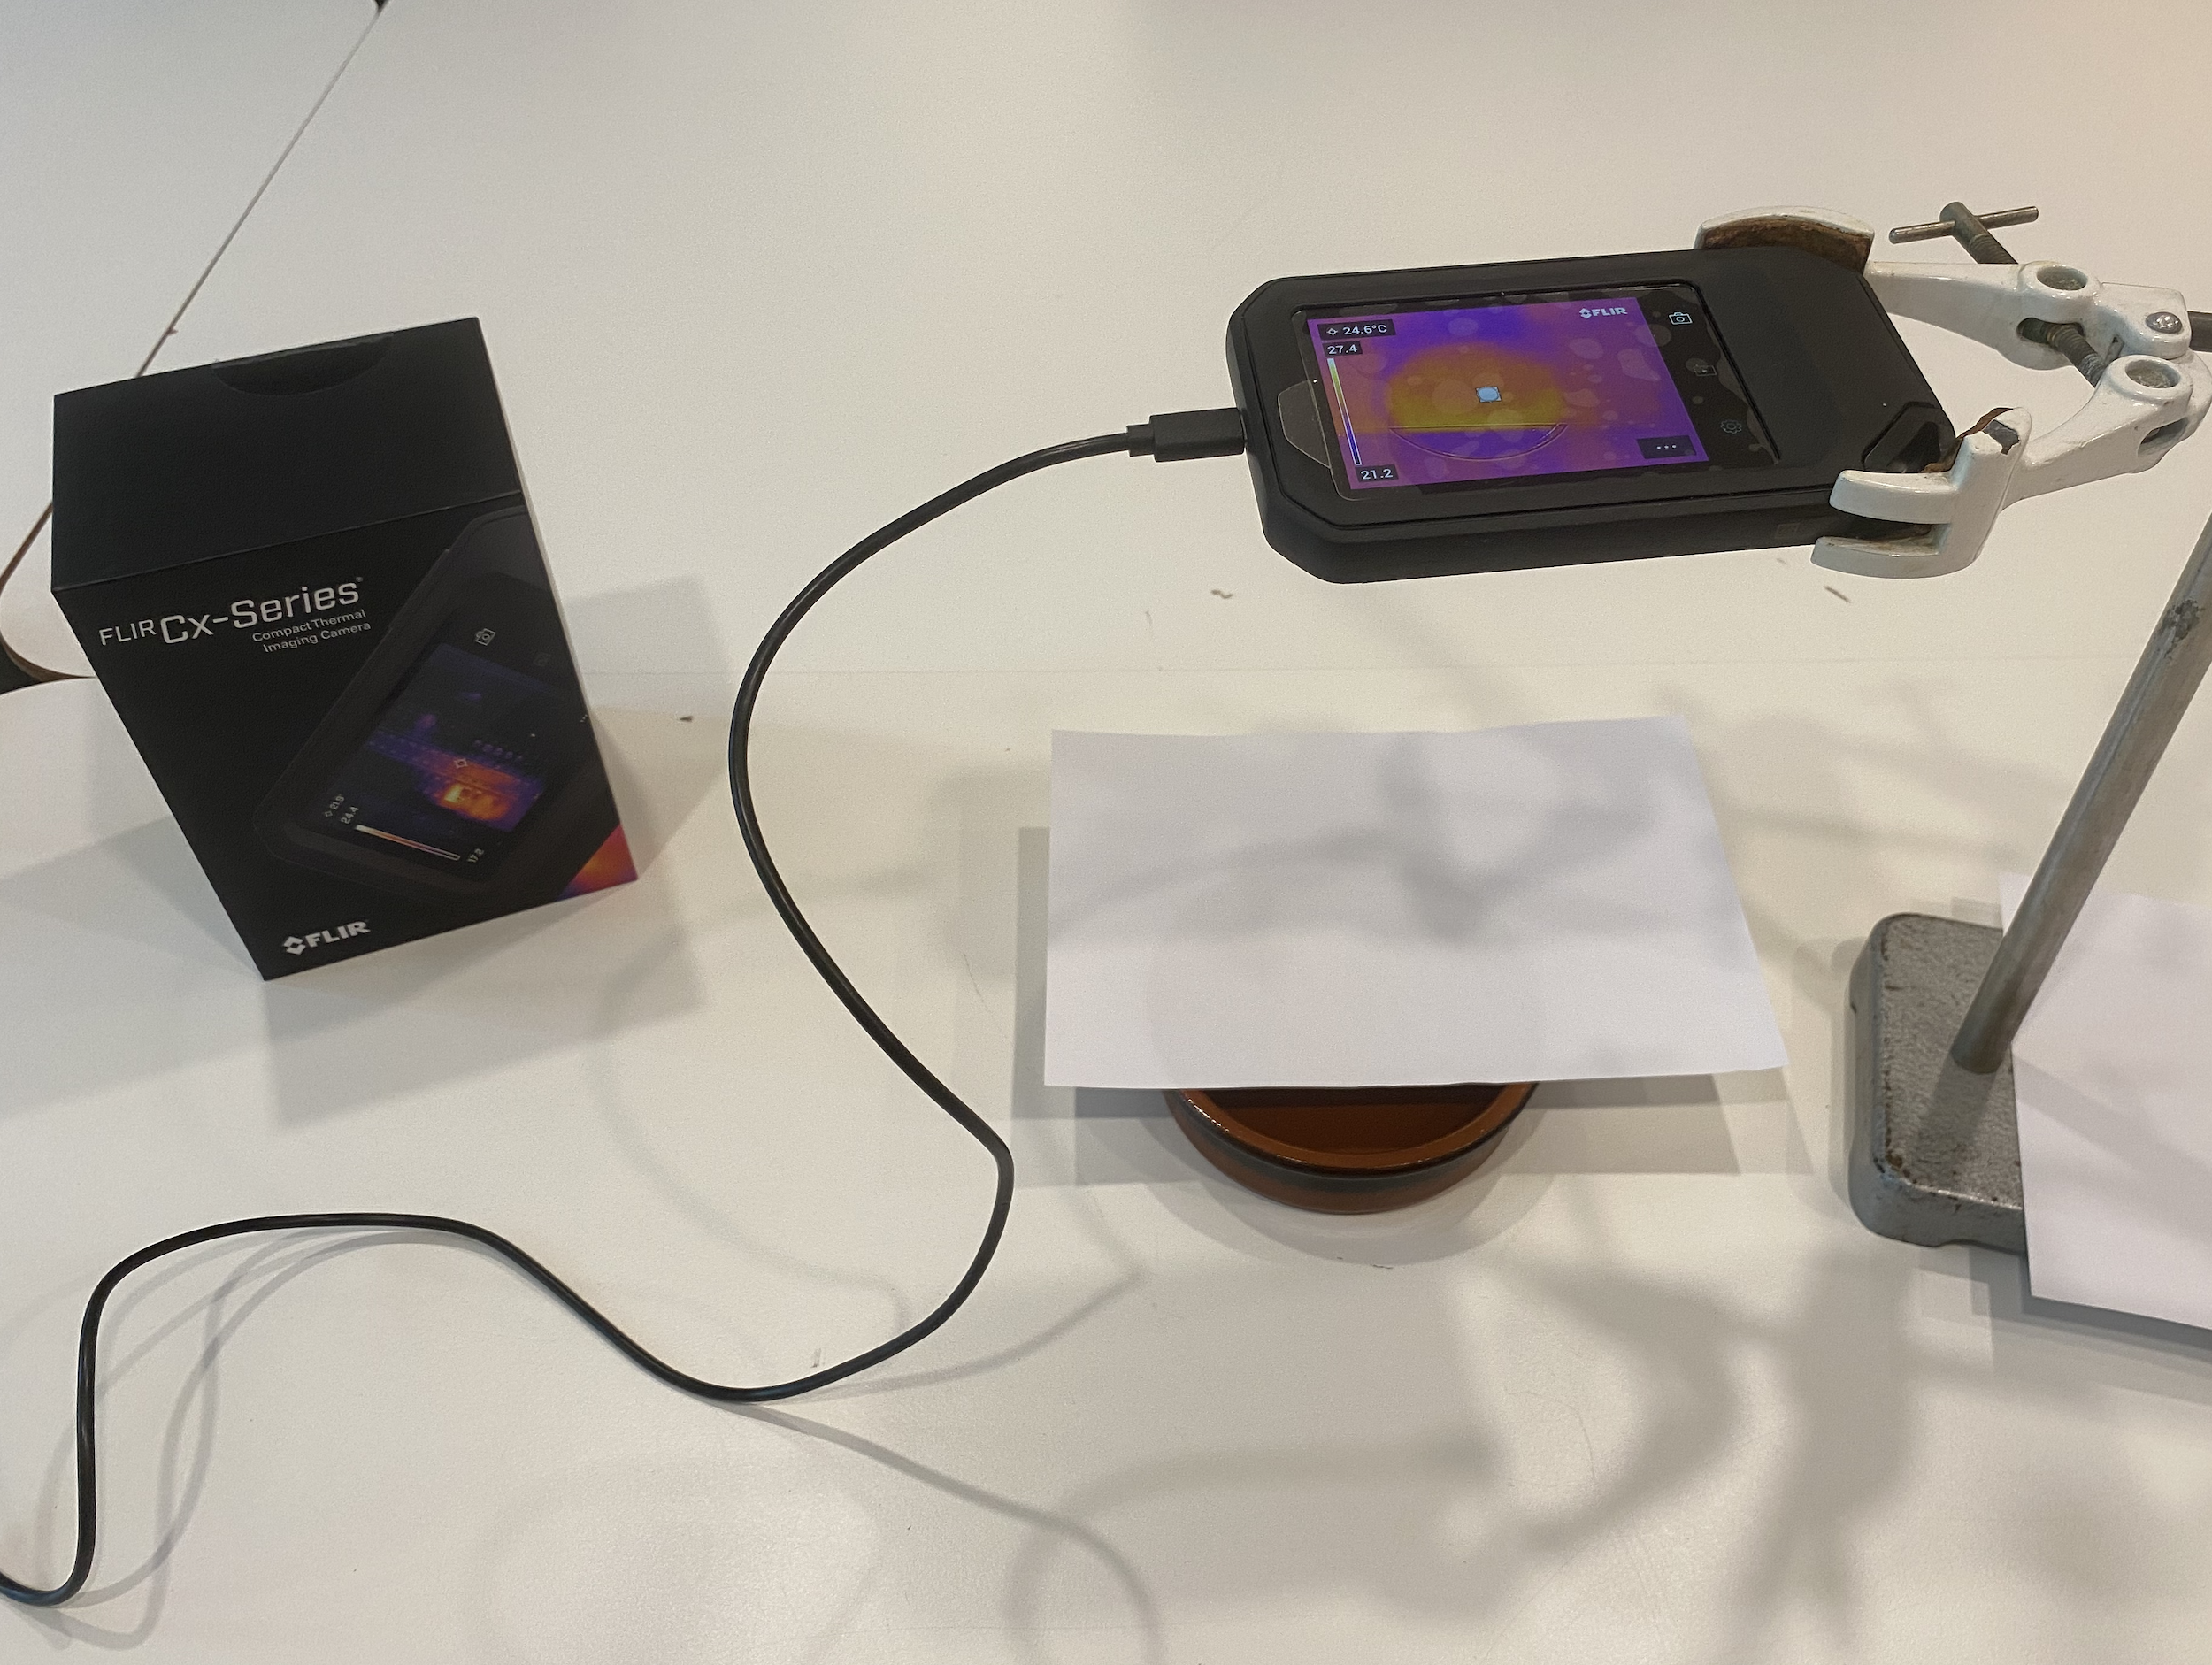
Fig. 18.18 Setup for this experiment: FLIR C5 camera connected to a computer. Clamped in a stand clamp perpendicular to the dish under the paper.#
Materials Needed#
Infrared camera (Flir C5)
Round dish (e.g. a petri dish)
A few sheets of (printer) paper
Stand clamp
Preparation#
Place the infrared camera in a stand so that it is directed from above onto the setup.
Place the dish with water under the camera.
Turn on the camera with streaming mode enabled and connect it to your computer.
Open a camera app on the computer and let it display the image from the infrared camera.
Set the distance (on the touchscreen) of the infrared camera to the correct value. Enter the emissivity value of paper (approximately 0.70) into the infrared camera.

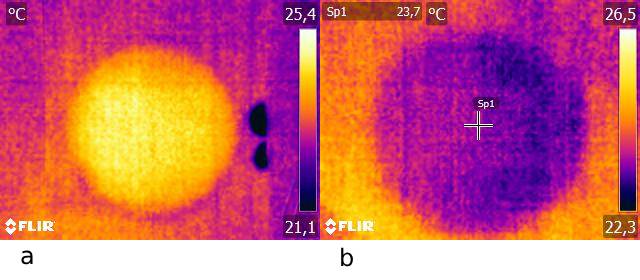
Fig. 18.19 a. The surface of the paper on which water has condensed is clearly visible. At the edge of the paper, you see two water droplets where the water evaporates and causes a lower temperature.
b. Cooling of the paper due to evaporation.#
Procedure#
Students already have knowledge of molecular theory and phase transitions.
Set up the apparatus and explain to the students what they see. Tell them you are going to place the sheet of paper on the dish of water. The infrared camera measures the temperature.
What happens to the temperature of the paper?
A. The temperature will remain the same
B. The temperature will decrease
C. The temperature will increasePerform the measurement. Read the temperature of the paper above the water and also of the part of the paper that falls beside the dish. Use the movable temperature spot on the touchscreen to measure the temperature of these parts of the paper.
Now tell them that you are going to remove the paper from the dish and quickly turn the paper. Measure the temperature of the bottom of the paper.
What happens to the temperature of the part of the paper that was above the dish with water?
A. The temperature will remain the same B. The temperature will decrease C. The temperature will increaseTalk about the condensation and evaporation of water and how energy is needed and released respectively.
Questions to check students’ understanding: Why do you blow on a bowl of soup to cool it down? A puddle of rainwater also evaporates even if it is not one hundred degrees Celsius outside. What can you say about the temperature of the puddle compared to the ambient temperature?
Perform the calculation of the number of layers of water molecules on the paper. See physical background.
Physics background#
The rise in temperature of the paper is caused by the condensation of water vapor from the dish underneath the paper. When the water molecules in the vapor condense, they release heat. The heat conducts through the thin paper and causes a temperature rise. The amount of water molecules condensing on the paper is so small that you barely feel moisture when you touch the paper, but it is enough to cause a temperature rise which is detected by the infrared camera.
This heating mechanism can be confirmed by holding the paper above the cup for a minute until it reaches thermal equilibrium with the surroundings and then removing the paper. IR images of the paper show that the temperature of the originally heated circular zone drops immediately after removal to below the ambient temperature. This can be explained by the water molecules that had condensed on the underside of the paper beginning to evaporate, resulting in rapid cooling of the paper.
The water molecules condensed on the paper apparently cannot penetrate through the paper, otherwise, you would have observed evaporation cooling on the other side of the paper with the infrared camera.
How thick was the condensed water layer approximately?#
For our experiment with a dish with a diameter of 10.5 cm, we measured and looked up the following:
\(ΔΤ ≈ 1.0\) ºC
\(ρ_{paper} = 80\) g/m²
\(c_{paper} = 1.4·10^3\) J/kg·K
\(L_{water} = 2.26·10^3\) J/g
\(M_{water} = 18 \) g/mol
The energy released on the paper is:
The mass of water condensed on the paper:
At room temperature, 1 g of water has a volume of 1 cm³. For the circular part of the paper, this means that a water volume of 4.29·10⁻⁴ cm³ is distributed over a cylindrical surface of the paper. The height \(h\) of this water cylinder is then:
The water layer on the underside of the paper is thus approximately 50 nm thick.
The average volume of a water molecule can be estimated with the molar mass, written as a kind of “molar density” (\(M_V = 18\) cm³/mol) and the number of molecules in a mole (\(N_A\)). With this volume, we calculate the one-dimensional dimension of a water molecule:
The number of layers (\(n\)) of water molecules can then be calculated with:
Considering that not all the heat is released at once, the rate of water vapor deposition is likely a few nanometers per second. So we are studying a nanoscale process.
Tip
Place the setup visibly on the desk. Project the measurement via the computer onto a screen or digital board. Ensure the temperature is easy to follow by, for example, directing a temperature spot of the camera at the spot to be measured.
A water droplet on the edge of the paper will also be clearly visible with a lower temperature due to evaporation (see Figure 18.19).
After a few hours, the setup shows the paper has a lower temperature. Paper is porous, and the water molecules evaporate again at the surface of the paper.
Hold the paper vertically above the dish as well to show condensation vertically.
