8.3. Debugging in VS Code#
When learning to program, debugging is an essential skill to master. Debugging allows you to step through your code to understand its behavior and identify where things go wrong.
So far, did debugging in our Python programming using print statements.
However, as you may have noticed, that way of searching for bugs includes changing your code (to add test print statements) and then altering your code again (by removing the test print statements) once you have identified and fixed the bug.
In this section, we will explore a more powerful way of debugging, using VS Code, which doesn’t include altering your code with print statements.
In this section, we will cover the basic debugging features in VS Code: breakpoints, single stepping, and viewing variables.
The explanations and examples in this page are, therefore, also meant to be tried out in VS Code, which we encourage you to do.
8.3.1. Key terms#
Breakpoint: A point in your code where the program will pause execution, allowing you to inspect the current state and step through the following lines of code. Breakpoints are helpful when you know the area of the code where a bug might exist. You can place breakpoints around suspicious code blocks to pause the program at key points.
Single stepping: The process of moving through your code one line at a time to observe how each statement affects the program. Single stepping is useful when you need to observe the flow of your program in a fine-grained manner. Step through the code to ensure it executes as expected, and verify that each variable is set correctly.
Local and global variables: Local variables are those defined inside a function and are accessible only within that function. Global variables are defined outside of functions and are accessible from any part of the code. Viewing local and global variables is crucial for understanding the current state of your program. If the values are not what you expect, this can give you insight into potential bugs or logical errors. See also previous book section.
8.3.2. Best practices for debugging#
Start by placing breakpoints near the code where the error occurs. Gradually move breakpoints earlier in the code if the issue isn’t obvious.
Use single stepping to see if the flow of control is behaving as expected.
Continuously check the values of variables as you step through the program. If a variable holds an unexpected value, that’s often where the problem lies.
8.3.3. Debugging in practice#
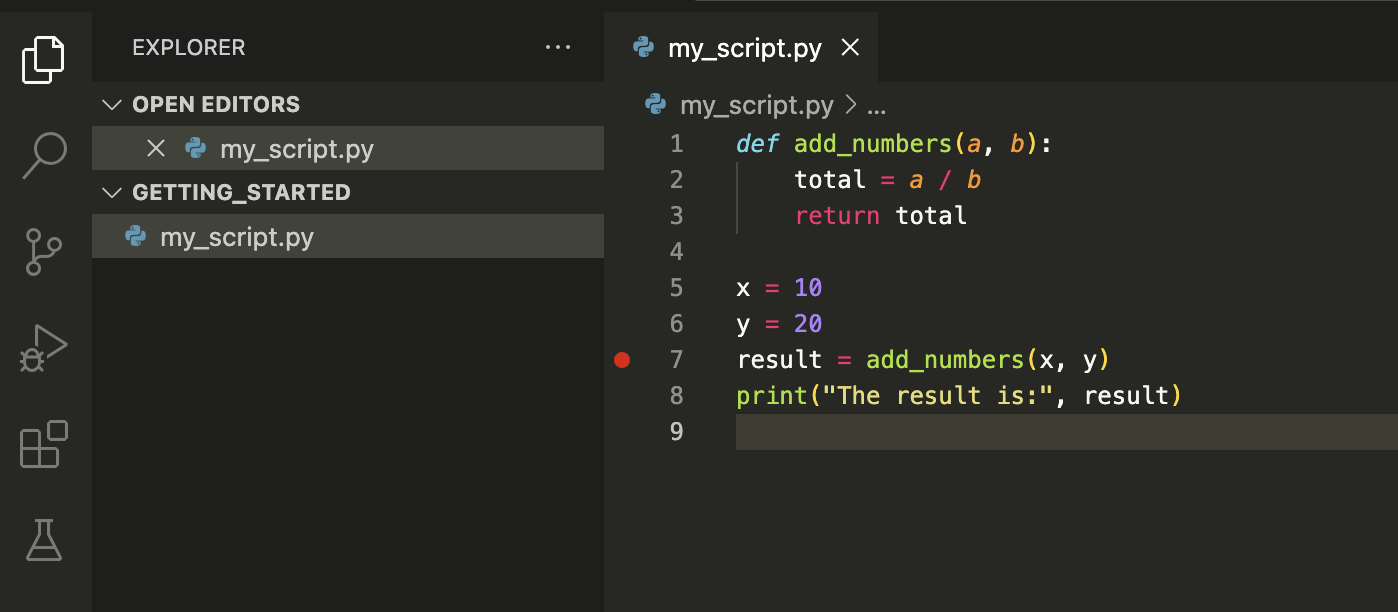
How do we perform debugging in practice within VS Code? Let’s look at a code which defines a function that is supposed to add two numbers (a + b) and then applies this function of a given x and y.
To add a beakpoint in VS Code, click on the left side of the code line number. A red dot will appear, meaning that you have successfully added a breakpoint. To remove a breakpoint, click on the red dot and it will disappear.

Fig. 8.1 Red dot indicates a breakpoint in VS Code.#
To initate the process of debugging in VS Code, click Run and Debug in the activity bar on the left side, then again Run and Debug. You may need to make a few more choices when prompted, such as selecting Python debugger and telling VS Code to debug the currently active file.
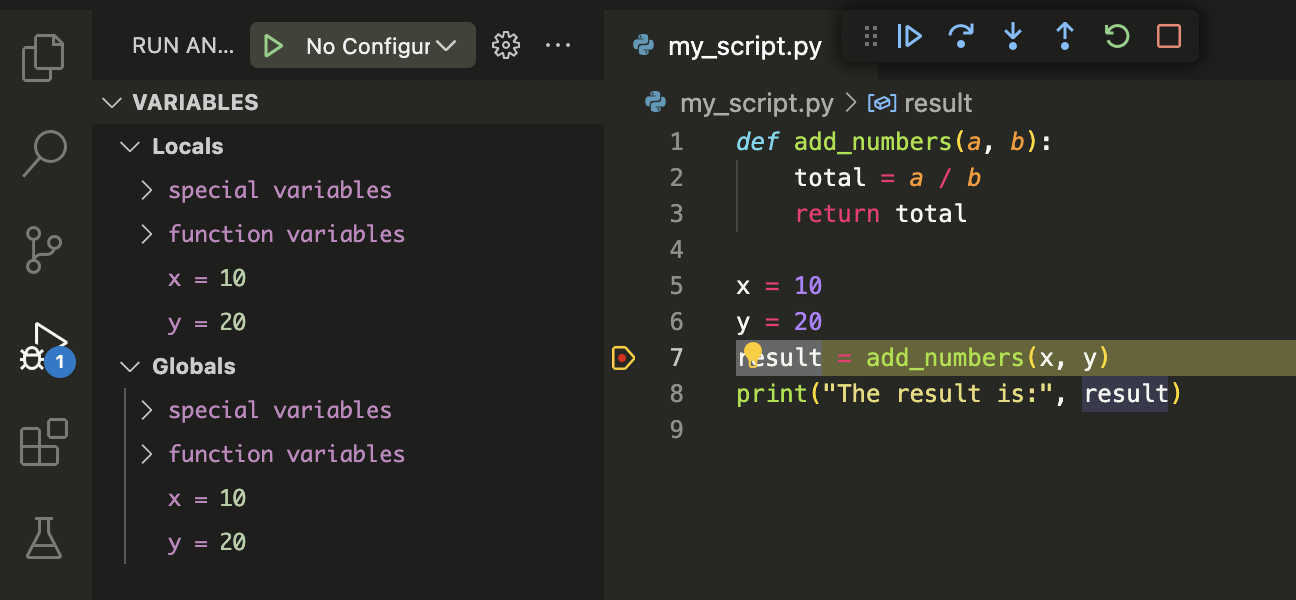
Once debugging has initiated, you will see something like this:

As you have noticed, on the left side you can now view your local and global variables at the given breakpoint. In addition, notice that the debugging bar has appeared on the top of your VS Code window. If you hover over symbols in the debugging bar, you will see their meanings, namely:
Continue (to next breakpoint)
Step Over, Step Into, Step Out
Restart, Stop (debugging)
Let’s explore the difference between the different stepping options and when to use each of them.
8.3.4. Single stepping#
Step over. The debugger executes the current line of code and moves to the next line in the current function. If the line contains a function call, the entire function will be executed, but the debugger will not enter that function. Instead, it will move to the next line after the function call. Use this option when you want to execute the current line and continue to the next line without diving into any functions called on that line. This is useful for skipping over functions whose internal behavior you don’t need to inspect.
Step into. Allows you to go into the function that is called on the current line of code. If the current line contains a function call, the debugger will enter that function, allowing you to debug it line by line. Use this option when you want to inspect the behavior of a specific function in detail. If you suspect there might be an issue within that function, stepping into it lets you see how the code executes line by line.
Step out. Runs the remaining lines of the current function and pause at the line of code immediately following the function call in the calling function. It effectively allows you to exit the current function without stepping through every line. Use this option when you are inside a function and have seen enough of its execution.
Action |
Description |
When to use |
|---|---|---|
Step over |
Executes the current line, skipping over function calls, and moves to the next line. |
When you don’t need to inspect the function’s internal behavior. |
Step into |
Enters the function called on the current line, allowing you to debug it line by line. |
When you want to inspect a function’s behavior closely. |
Step out |
Completes the execution of the current function and returns to the caller. |
When you have finished debugging the current function and want to return to the calling code. |
8.3.4.1. Example#
Explore single stepping options in Python’s debugger by yourself!
Copy this code in a Python script in your VS Code:
def multiply(x, y):
    return x + y

def calculate_area(length, width):
    area = multiply(length, width)
    print("Area:", area)

length = 5
width = 10
a = calculate_area(length, width)

print("This is x: ", x)
print("This is y: ", y)
print("The area is: ", a)
Look at the code. What does it do? Are there any mistakes/bugs in it? If yes, keep them in the code for now.
Place a breakpoint on the last line of the code:
calculate_area(length, width). Start debugger in VS Code. Observe variables in this point.Explore different stepping options. First, try to click Step over (you can continue clicking on it more than once). What happens? To which line in code does the debugger go? If you find a bug, feel free to correct it.
Restart your debugger. This time, try to use Step into. In which order does the debugger check your code lines?
Restart your debugger again. Use Step into, but while you’re inside the
multiplyfunction, click on Step Out. What happens in this case?
