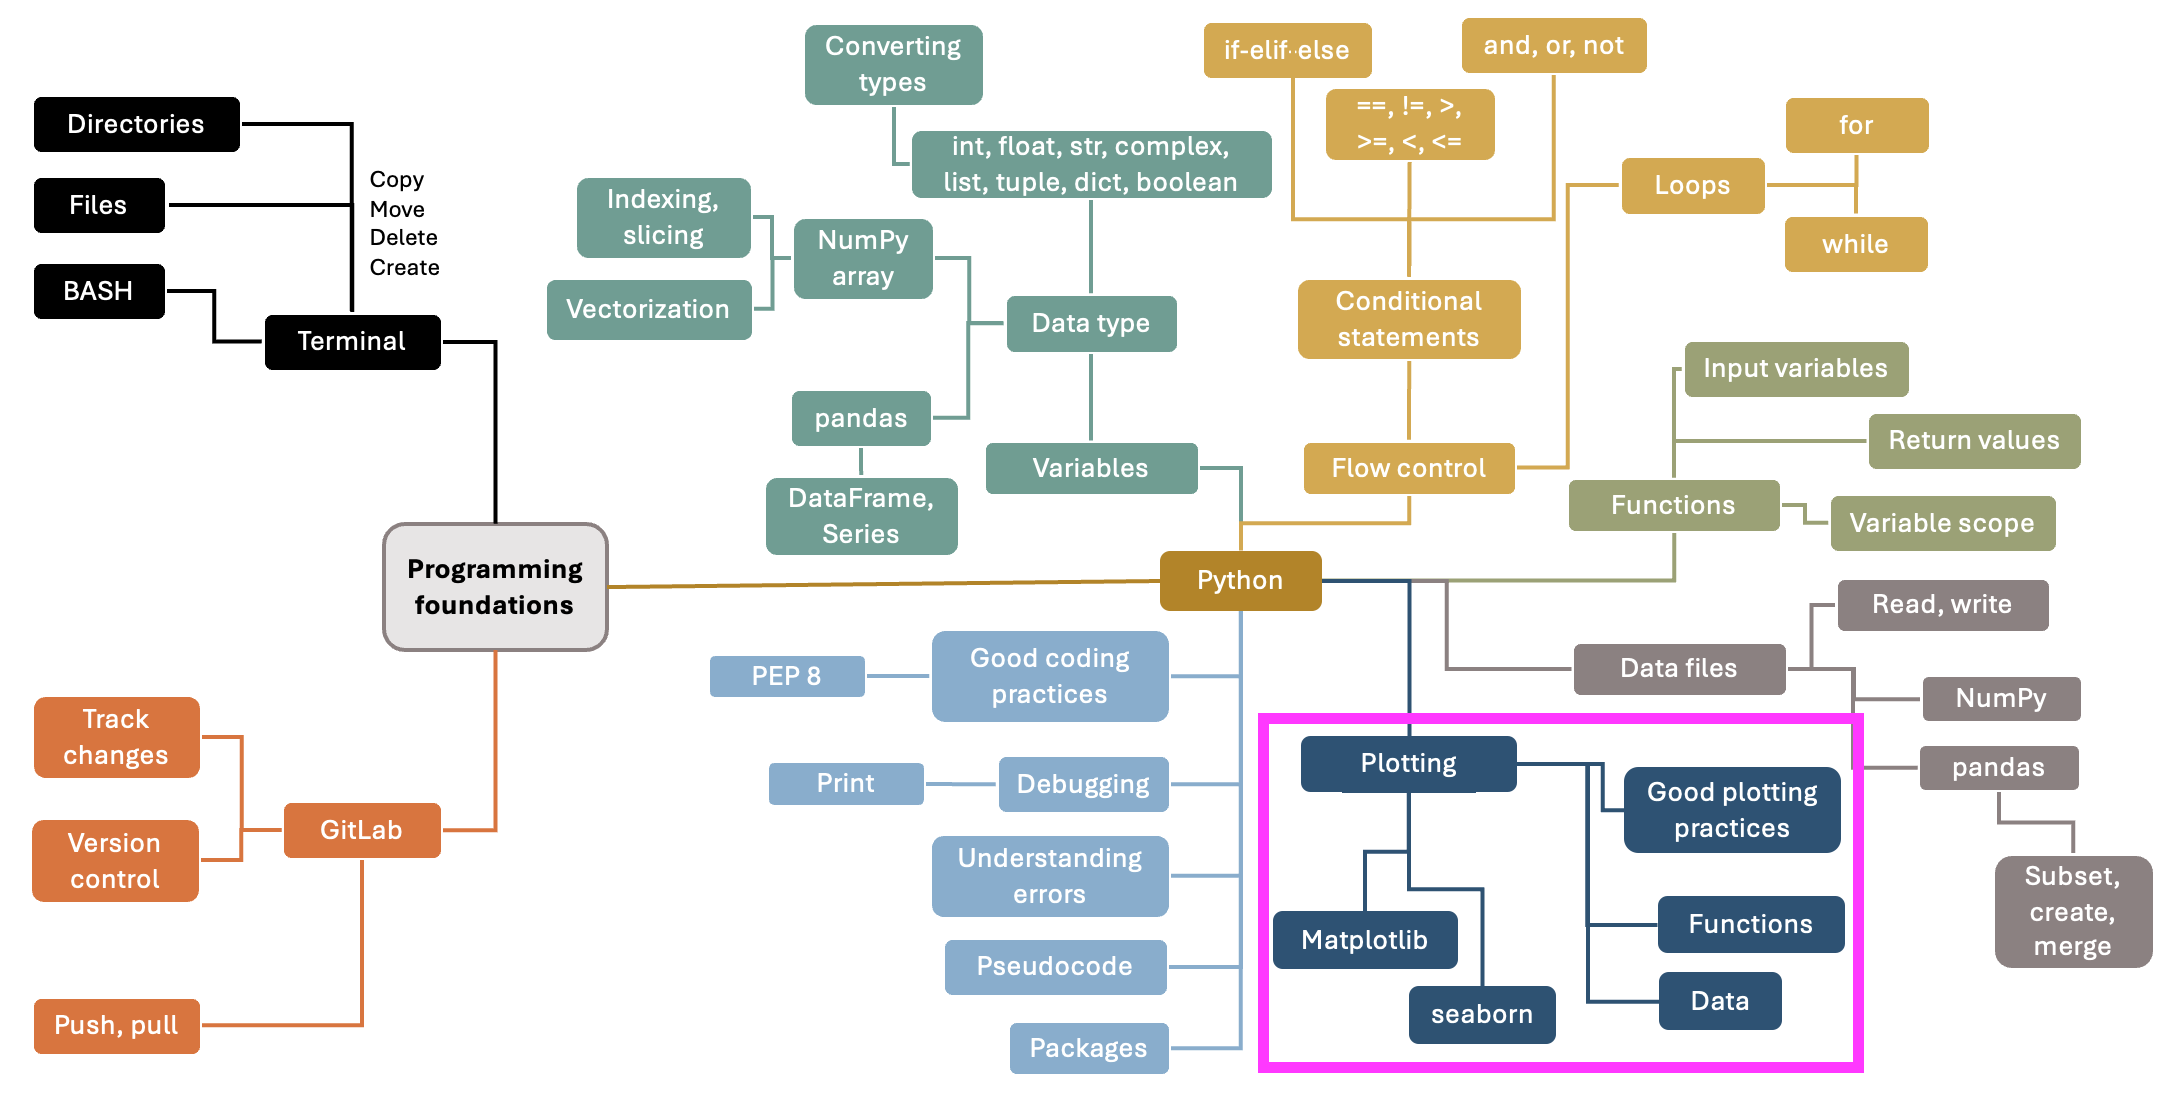
10. Data visualization#
A picture is worth a thousand words.
You’ve probably heard this phrase before, and it stands true in science: a well-made plot can represent your data and convey your message much better than a paragraph of text or a large table filled with numbers. That’s why you always see plots in scientific publications.
In this chapter, we will explore good data visualization practices and do hands-on plotting of data in Python.