Optimization Example#
Economic optimization is illustrated through the determination of an optimial dike height to protect against flooding.
Before the major floods of 1953, dikes in the Netherlands were not designed for a specified safety level but mainly strengthened based on practical experience. One of the main questions after the disaster was the optimal dike height and the “acceptable” probability of flooding. Van Dantzig was a professor in mathematics and a member of the first Delta committee. He developed an econometric approach to determine the optimal probability of flooding (or protection level) and the corresponding dike height (van Dantzig, 1956).
Probability and Risk#
The approach only considers failure of the dikes due to overtopping. The probability distribution of water levels along the Dutch coast can be approximated by an exponential distribution.
In which:
\(h\) the water level [m]
\(A,B\) constants of the exponential ditribution [m]
Neglecting wave run-up, the probability of failure of the dikes - leading to flooding - can be approximated by the probability of exceedance of the dike height \(h_d\), i.e.
It is assumed that there is total damage to all objects and infrastructures in the flooded area if the dikes fail. For the discount rate Van Dantzig applied a reduced interest rate \(r^\prime\) = economic growth – inflation. The net present value of the expected damages (i.e., the risk) is found as follows, assuming an infinite time horizon:
Costs and Benefits#
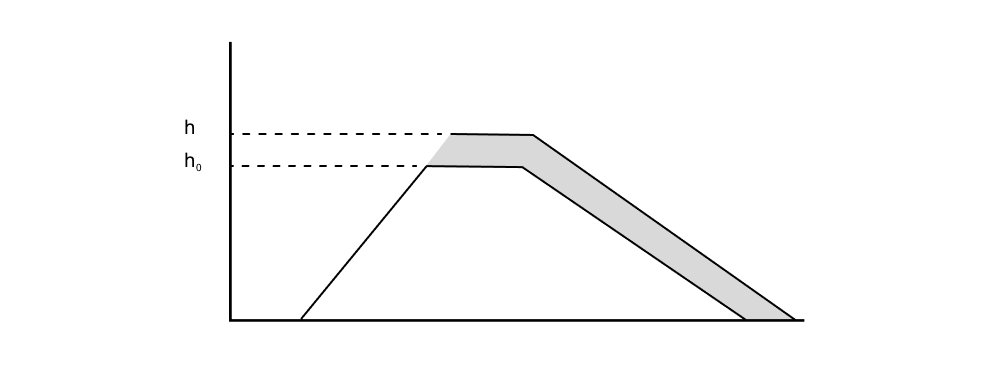
As the risk is dependent on height, the dikes can be heightened further to limit the failure probability and thus risks. Investments in dike heightening are determined by initial costs for mobilization and variable costs that are dependent on the level of dike heightening (see also Fig. 27):

Fig. 27 Schematic view of dike heightening#
Now, the total costs \(C_{tot}\) are the sum of the investment costs and the risk.
The optimal dike height is found when the total costs are minimal. This is the case when \(dC_{tot}/dh_d=0\).
Since the \(P_f = e^{-(h_d-A)/B}\), we can find the optimal flooding probability \(P_{f,opt}\):
The larger the damage \(D\), the smaller the optimal failure probability and thus the higher the level of protection. If incremental protection is expensive – i.e. for high values of \(I\) – a higher optimal failure probability and thus a lower level of optimal safety will be found. The optimal failure probability is also dependent on the discount rate. Combination with (7) gives the optimal dike height \(h_{d,opt}\):
Verification#
In addition to the determination of the optimal dike height the cost benefit criterion should still be verified by checking whether the benefits of risk reduction are larger than the costs of dike heightening.
Where \(P_{f,0}\) the flooding probability in the initial situation. It can be easily shown that this is equivalent to a check of whether the total costs in the optimal situation are smaller than those in the original situation. The first Delta committee used the following values for South Holland:
\(D\) = fl 24.2\(\cdot 10^9\) [unit is Dutch guilders]
\(r^\prime\) = 0.015
\(I\) = 40.1\(\cdot 10^6\) fl/m
\(A\) = 1.96 m
\(B\) = 0.33 m
\(h_0\) = 3.25 m
\(I_0\) = fl 110\(\cdot 10^6\)
Using these values, the following optimal dike height and optimal failure probability were derived:
\(h_{d,opt}\) = 5.83 m
\(P_{f,opt}\) = \(8 \cdot 10^{-6}\) per year
Discussion#
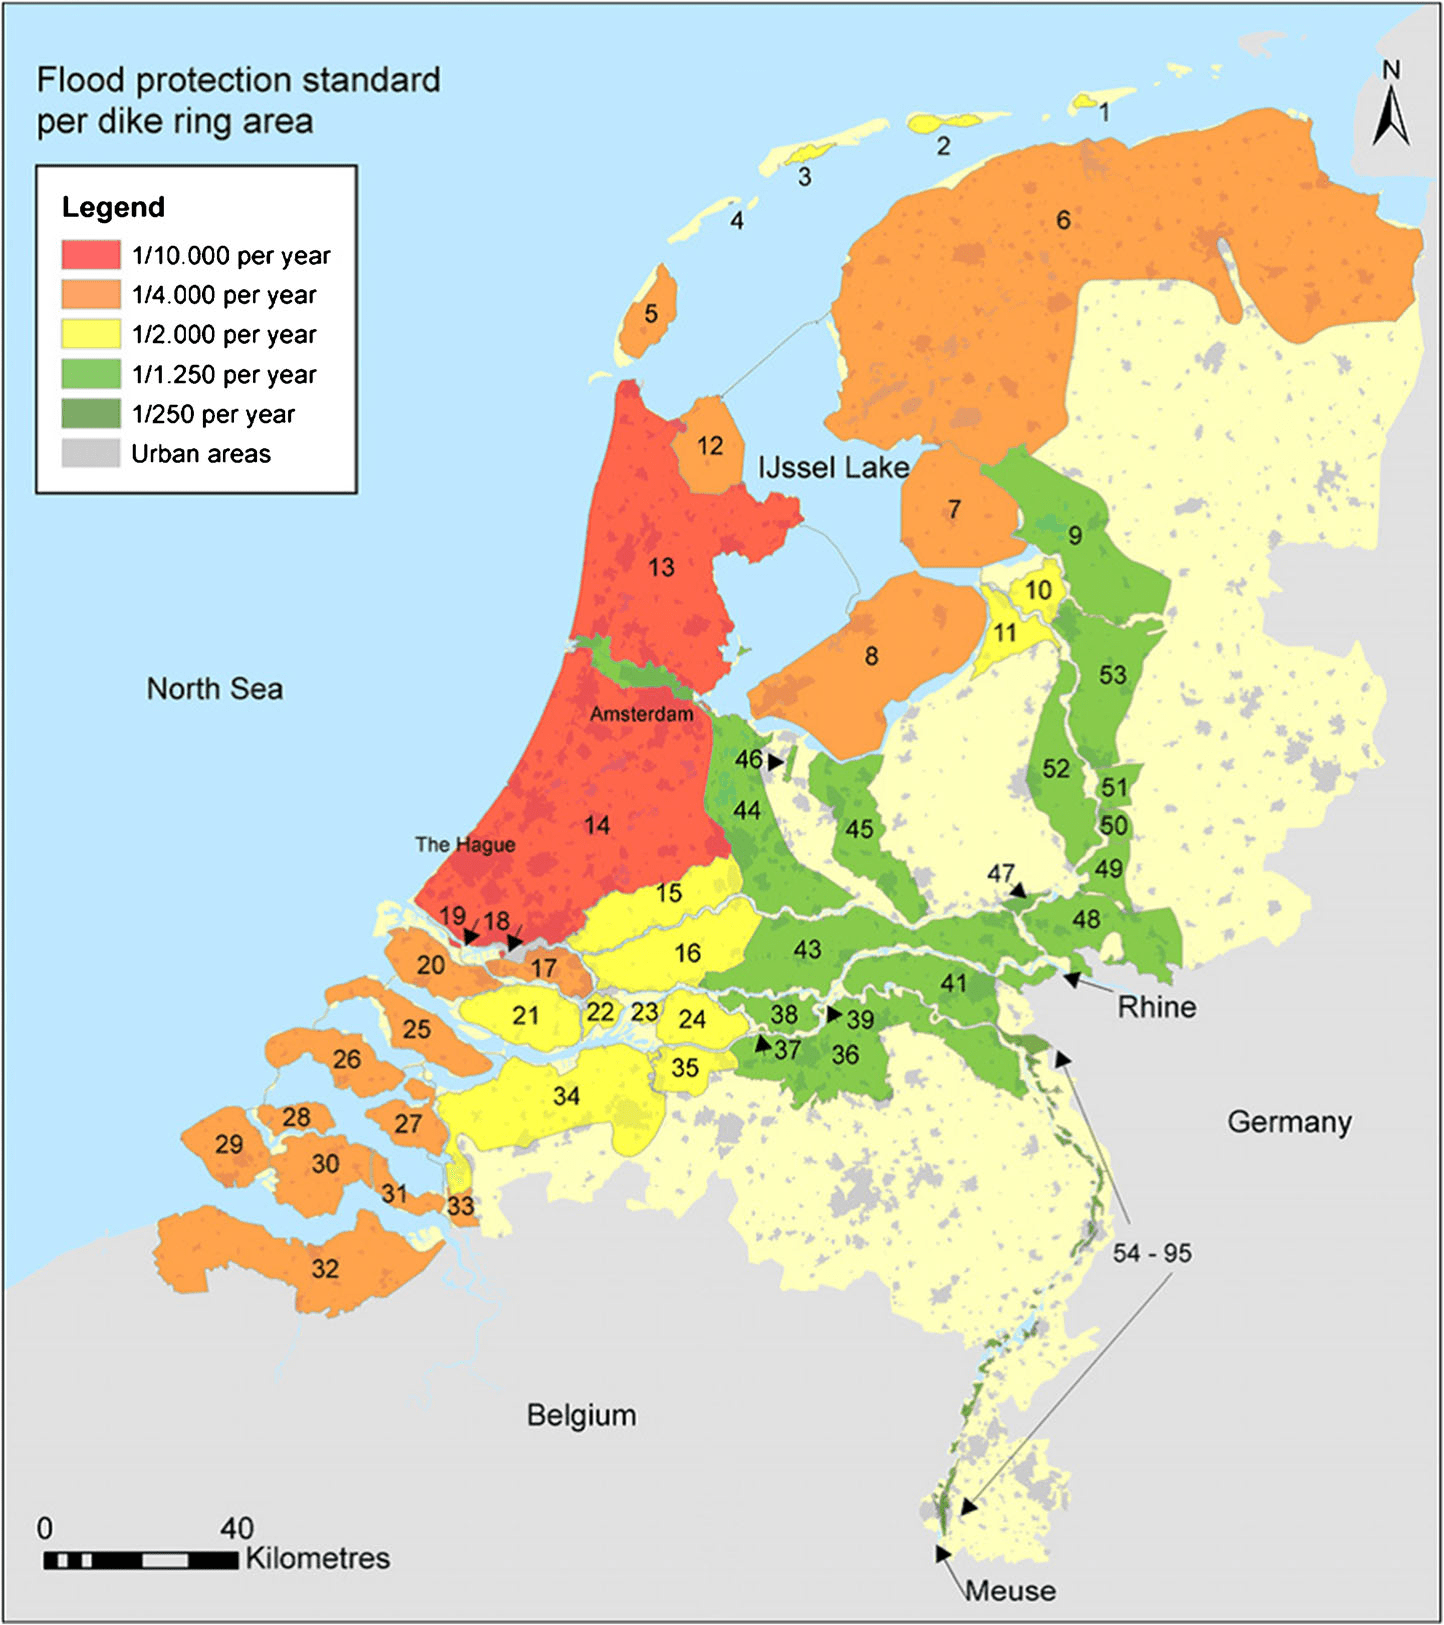
Although the optimal safety level was determined at a failure probability of \(P_{f,opt}\) = 1/125,000 per year, in later political discussions a value of 1/10,000 per year was selected for the probability of exceedance of design water levels. This implied that the dikes of South Holland would need to be designed for hydraulic conditions (water levels and waves) with a probability of exceedance of—on average—1/10,000 per year. In later decision-making, safety standards were derived for other dike rings, for example, flood defenses in the river system were designed for a safety standard of 1/1250 per year. A map illustrating the different safety levels is shown in Fig. 28.

Fig. 28 Dike Rings in the Netherlands, showing probability of exceedance of the design water levels per dike ring. Note that dike rings along the River Meuse are not shown on this map. Most of these dike rings have a safety standard of 1/250 per year. This map defined design levels until the safety standards changed in 2017. Source: shared under a CC-BY 4.0 license (Tsimopoulou et al., 2015). The original can be accessed online via the publisher here, and the license is specified here.#
It was expected that the actual failure probability for dikes designed for this design load, would be smaller than 1/10,000 per year. Recent risk analysis in the project VNK[1] have shown that this is not the case due to the geotechnical failure mechanisms. For most dike rings, the estimated failure probabilities are larger than the probability of exceeding the design loads. For example, for riverine dike rings that had been designed for design levels with a probability of exceedance of 1/1250 per year, failure probabilities are often in the order of magnitude of 1/100 per year (Veiligheid Nederland in Kaart, 2014). This is part of the reason for revising the safety standards and flood defence assessment criteria in the Netherlands, which since 2017 is based on an allowable probability of flooding rather than a load-based exceedance probability approach.
Historic discussions and developments in the Netherlands illustrate how the risk analaysis and risk management for a given system can change over time. Several extensions and additions to the van Dantzig model have been proposed over the years. For example, the inclusion of sea level rise (Vrijling and van Beurden, 1990), modelling of the damage as dependent on the water depth in the polder (van Dantzig, 1956), the inclusion of the economic value of loss of life as part of the damage, and inclusion of risk aversion by giving quadratic weight to the damages (Gelder et al., 1997).
The model by van Dantzig was primarily focused on finding what the optimal safety at that time (when van Dantzig published his model in the 1960’s) should have been. However, a single optimal level is not always the best solution. While considering longer timescales and changing conditions, such as economic growth and sea level rise, the model needs to address the possibility of multiple interventions during the period considered. This leads to questions regarding the timing of interventions (when? At which intervals?), as well as the optimal strengthening or raising of the dikes (how much?). Eijgenraam (2006) developed an economic decision model that takes into account both questions.
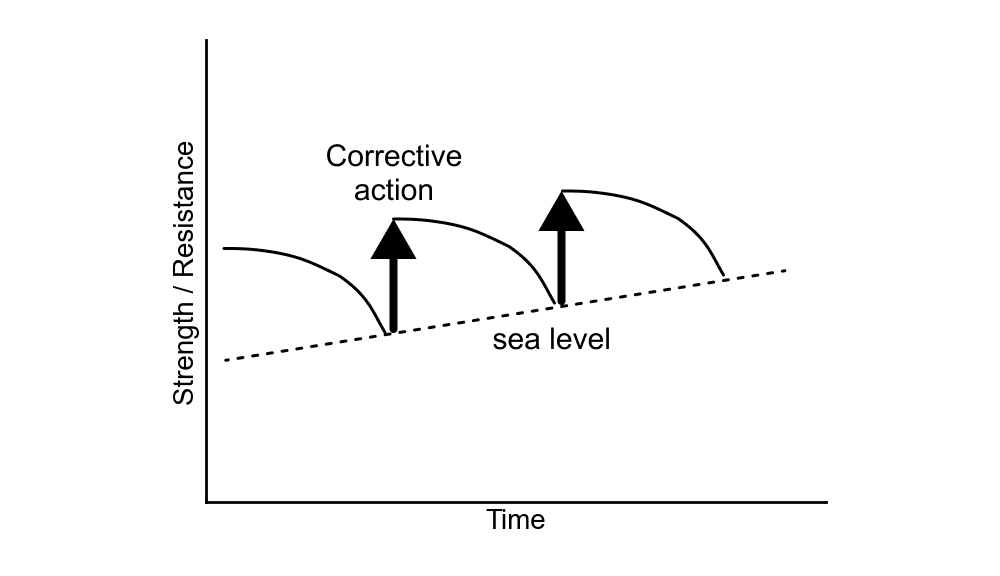
Fig. 29 below depicts the “saw-tooth” curve that shows the periodic interventions: both the extent of the intervention (vertical) as well as the timing between interventions (horizontal). In between interventions, the safety will gradually decrease due to sea level rise and / or subsidence of the dike. Over a longer period of time, the dike heightening (or strengthening) should follow sea level rise. Additional dike heightening (lower the failure probability even further) could be considered in case of economic growth, which will lead to an increase of damages and increase of protection standards. The length of the optimal interval between interventions is largely dependent on the initial or mobilization costs. If these are high, for example in the case of structural interventions such as storm surge barriers, a long interval or life time of almost 100 years can be chosen. For regular dike reinforcements this interval will be more in the range of several decades (e.g. 50 years). For interventions with no or very small initial costs, such as nourishments along the coast, it is optimal to intervene more frequently.

Fig. 29 Periodic investments in dike reinforcement for a situation with sea level rise.#
