FN Curve#
A small town is located in a seismic region threatened by two faults. Fault A has a 10% probability of occurring each year, which would cause 10 fatalities, and Fault B has a 1% chance of occurring, which would cause 100 fatalities. Construct an FN curve for the town. Assume that the town is risk averse and that the tolerable risk limit is governed using a constant of C=1.
Question 1: Compute the expected annual fatalities for the town.
Answer
Question 2: If the town improved the safety of its buildings, what would be the maximum allowable number of fatalities that would be considered acceptable due to an earthquake on fault A?
Answer
Using the limit curve
Question 3: What is the maximum value for the probability of an earthquake on Fault B that would be considered acceptable by the town?
Answer
Using the limit curve
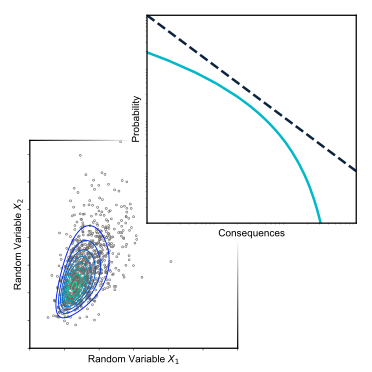
Question 4: Create an FN curve for this situation, including the limit line. Be sure to clearly label the axes and the values of key points on your diagram.
Note
If you are not sure what the limit line is, wait for this question until you read the Safety Standards Section (Risk Evaluation chapter).
Answer

Fig. 35 FN-curve for exercise 4#