Dam and River#
You are tasked to analyse the safety of a dam and the downstream river system. Downstream of the dam there is a dike ring protected by two main dike sections which must be able to contain water released from the reservoir. The dike sections are connected to each other and form a continuous boundary along the same side of the river. Let \(P(F_1)=0.01\) and \(P(F_2)=0.01\) denote failure probability of dike section 1 and section 2 respectively. There appears to be a correlation between failures of both sections, \(\rho_{1,2}=0.9\), and the figure below shows the effect of the correlation coefficient on the joint failure of the two sections.
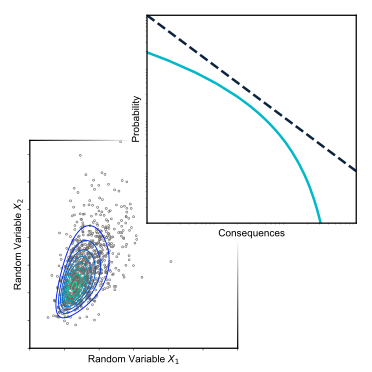
Fig. 38 Effect of correlation coefficient joint failure, \(P(A \cap B)\) (assume that \(P(A \cap B)=0.003\) at \(\rho=+0.9\), where the arrow is located).#
Question 1: Estimate the probability of flooding of the area protected by the two dike sections. Assume that the failure probability of each mechanism is 0.01, and they are not independent; however, you can use the figure above to quantify this.
Answer
Flooding of the protected area occurs when at least one of the two dike section fails. This is a series system. Thus, probability of flooding of the protected area can be determined by:
Based on the figure and the correlation \(\rho_{1,2} = 0.9\), the joint probability of failure \(P(F_1 \cap F_2)=0.003\) and the series failure probability is
Dam repair: probabilistic planning#
The dam has to be repaired. The responsible minister wants to make sure the whole project is finished within 12 months, and only accepts a probability of 10% that actual construction works exceed this duration. The dam reinforcement consists of two activities. The second activity can only start when the first one has been finished. The durations of both activities are uncertain and normally distributed. The first activity has a mean duration of \(\mu_1=4\) months and a standard deviation of \(\sigma_1 = 1\) month; for the second activity \(\sigma_2 = 2\) months.
Question 2: Compute the mean duration of the activity 2, so that the project duration would fall within the criterion given by the minister.
Answer
Let \(T_1\) and \(T_2\) denote the duration of activities 1 and 2; \(T\) denotes the total duration; \(T_1\) and \(T_2\) are normally distributed:
\(T = T1 + T2\) is also normally distributed, where
The probability of project duration greater than 12 months can be found with the complementary standard normal CDF, and should be a maximum of 0.1:
Applying the inverse CDF allows us to solve for \(\mu_1\):
Acceptable risk#
The government wants to study the acceptable risk and the acceptable probability of dam failure. Two criteria are used for acceptable risk:
Societal risk (SR): an FN limit line: \(P_f \leq 10^{-2}/n^2\).
Individual risk (IR): \(IR \leq 10^{-4}\) per year.
We know that mortality in case of dam failure is \(F_{d|f} = 0.1\) and that the population living downstream of the dam is 1000 people.
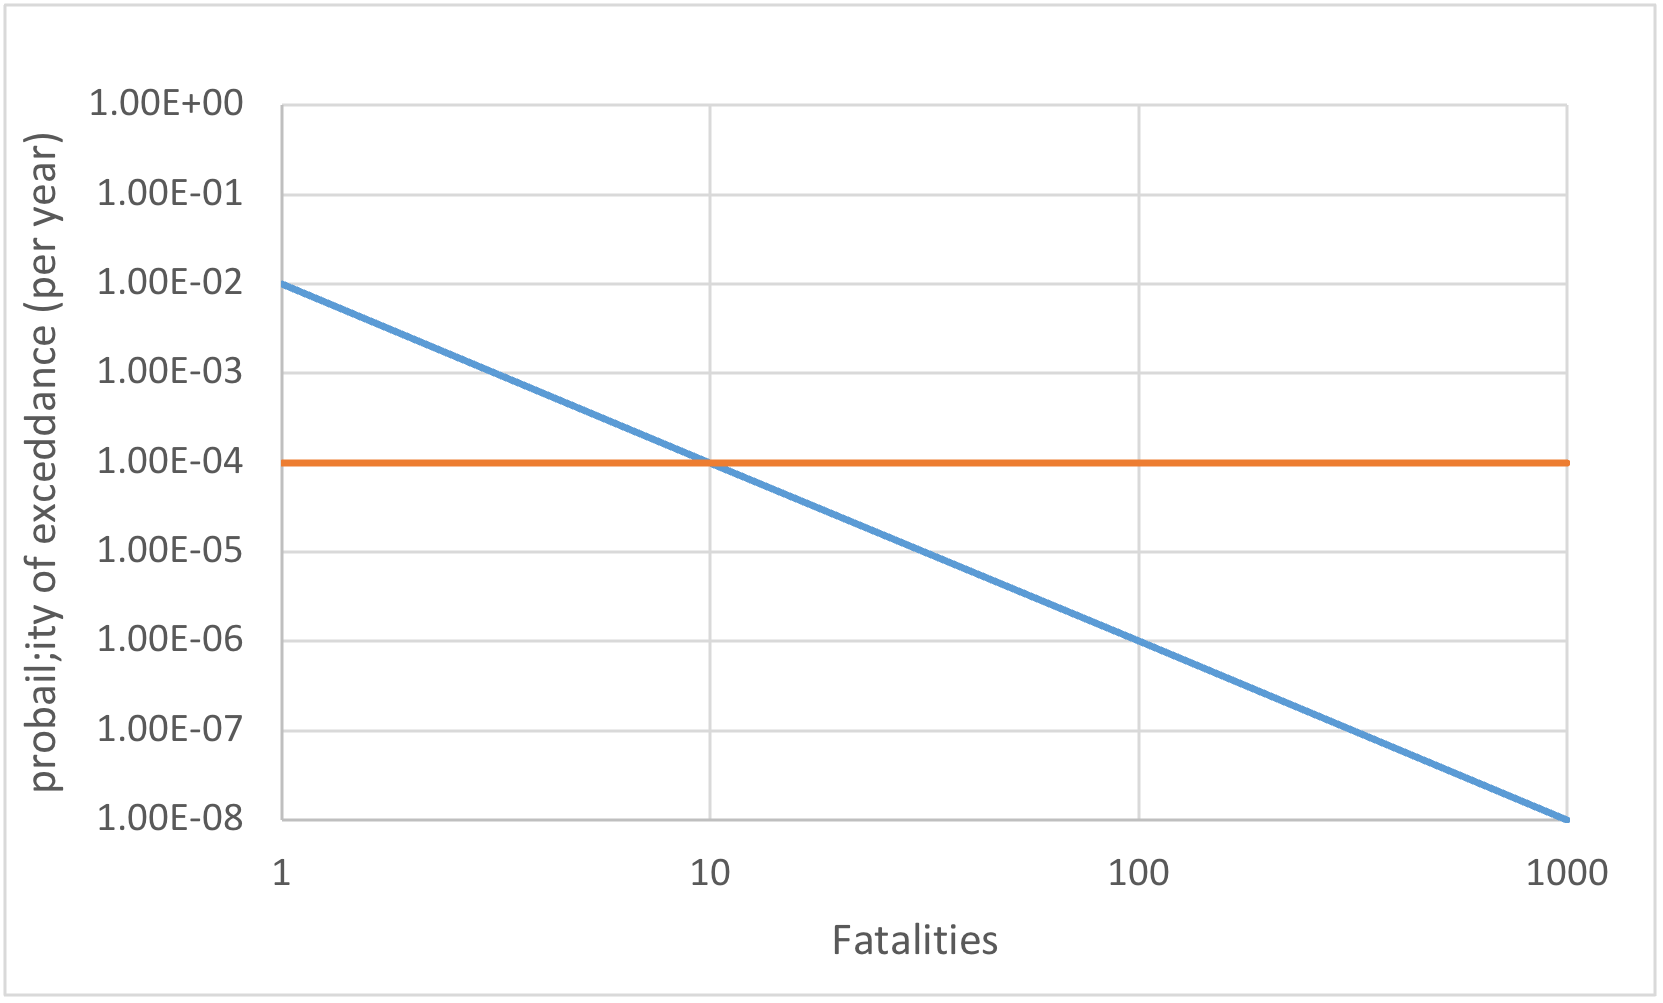
Question 3: Plot the FN limit line and indicate the acceptable probability of failure according to both criteria (individual risk, societal risk).
Question 4: Provide an advice on the acceptable probability of failure for the dam. Give the proposed numerical value and a short motivation.
Answer
Based on individual risk criterion, we have:
where \(P_{d|f}=0.1\). Hence, the acceptable probability of failure is:
Based on societal risk criterion (FN-Curve):
Acceptable failure probability can be determined by the FN-Curve:
Based on given information above, expected number of casualties per dam failure event is \(n = F_{d|f}\cdot 1000 = 100\).
The most stringent of the two criteria applies, so the proposed safety standard would be \(10^{-6}\) per year for the given inputs.

