Steps in a Risk Analysis#
The previous section made it clear that risk is a function of probabilities and consequences. Risk analysis, therefore, consists of an analysis of probabilities and consequences associated with undesired events in a given system. Alternative terms used in literature are risk assessment and quantitative risk analysis (QRA).
A risk analysis is carried out because involved parties (e.g. designers, managers, decision makers) want to identify and evaluate the risks and decide on their acceptability. Outcomes of risk analysis can be used in the design process to decide on the required safety levels of new systems (e.g. a new tunnel) or to support decisions on the acceptability of safety levels and the need for measures in existing systems (e.g. a flood defence system). A quantitative measure of some form is needed to transfer decisions on acceptable safety into a technical domain (Voortman and Vrijling, 2004), such as the height of a flood defence or the strength of a building. In addition, risk analysis can be used to analyse the effectiveness of risk reduction measures, including management and maintenance strategies. Whereas the primary goal of a risk analysis is often to support rational decision-making regarding risk-bearing activities (Apostolakis, 2004), it also provides insight in the way a system may fail. As such, it can also serve as a tool of communication and management. Insights drawn from a risk analysis can be used to optimize system design and management and often there is a direct link to quality assurance.
In general, the following elements can be identified within a risk analysis, (based on: CUR (Civieltechnisch Centrum Uitvoering Research en Regelgeving) (1997), Vrouwenvelder et al. (2001), Faber and Stewart (2003) and Jongejan (2008)):
System definition and setting the scope and objectives of the analysis;
Qualitative analysis of undesired events;
Quantitative analysis of the risk;
Risk evaluation (of the acceptability of the risk)
Each of these steps is illustrated in Fig. 11 and described in more detail below, providing context for the following chapters in this book. In addition to the risk analysis of a given system, risk management also includes the element ‘risk reduction and control’. Depending on the outcome of the first four steps of the analysis, measures can be taken to reduce the risk, which will lead to changes in the system configuration and risk level. Steps 1–4 are often repeated several times with adjusted system specifications to obtain an optimal design.
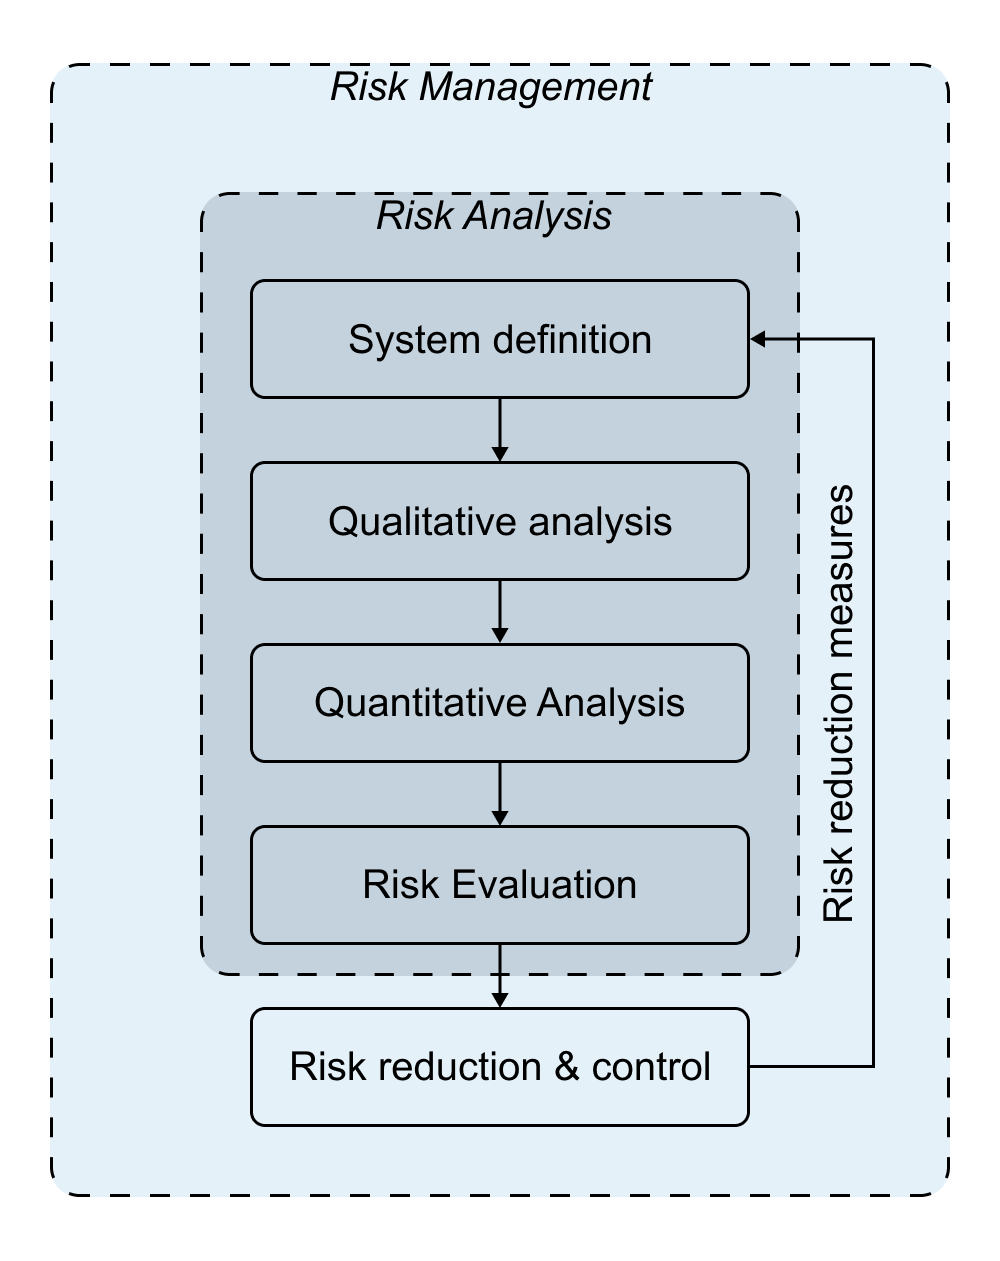
Fig. 11 Schematic view of steps in risk analysis (risk assessment) and risk management.#
1. System definition#
This step entails the definition and description of the system as well as the scope and objectives of the analysis. Usually a system is divided into components and subsystems, which can be schematised graphically. Further information on the decomposition and analysis of system is provided in the System Reliability Chapter of this book, and illustrated through the example exercises.
A system can be represented in terms of physical components, organizations and users, and an external environment. In order to analyse failure and risks, not only physical components, but also organizations and operators and users need to be considered (see e.g. Bea (1998)), as different groups of organizations and persons will be involved in different roles. Consider the aviation industry, where professionals may be responsible for operation and management of the system (e.g. the pilots and crew in an aircraft), but important roles are also played by the users of a system (passengers) and external parties (people living near the airport exposed to risk and noise). Each group has a different relationship and attitude towards the risk, which could affect its acceptability. For example, a higher risk might be acceptable for pilots and crews in an aircraft (who derive a direct benefit from flying) than for regular passengers. Finally, the external environment (e.g. wind or runway conditions) will determine the loads on the system and affect potential failure mechanisms.
2. Qualitative analysis#
In this step, potential hazards, undesired events, failure mechanisms and scenarios are identified and described. An important goal of this phase is to gain insight, as complete as possible, into all possible undesired events and their consequences. For most systems, multiple undesired events can be distinguished. For example, two events with different impacts that can both lead to flooding of a polder are 1) the inflow of large amounts of water due to a dike failure; 2) the inflow of smaller amounts of water when a sluice gate is not closed.
Failure occurs when a system no longer fulfils one or more desired functions, where the failed state can be reached through different failure mechanisms (or failure modes). For example, a dike can fail due to overtopping, but also due to geotechnical failure mechanisms such as instability or piping. A limit state is a condition of a structure beyond which it no longer fulfils the relevant design criteria (EN 1990:2002 E, 2001), of which two types are distinguished in practice: serviceability and ultimate limit states (SLS and ULS, respectively).
Ultimate limit state (ULS): failure or collapse of a system or structure occurs, for example, the breakwaters of a harbour entrance are destroyed as a result of extreme conditions. An example from structural engineering is the collapse of a roof of a building.
Serviceability limit state (SLS): exceedance leads to temporary and/or partial failure. For example, inability to use the harbour due to waves that are (temporarily) too high. Another example could be too much vibration of a structure, such that users experience discomfort.
Further information on the use of the SLS and ULS concepts in civil engineering is included in the Component Reliability.
In a risk analysis, it is very important to get an overview of the various undesired events and failures before proceeding with a quantitative analysis, as many accidents in practice are caused by failing to identify failure modes. Unfortunately, creating a complete list of threats and failure modes is not an easy task. Support for this process can be found through are failure databases, literature studies, interviews, experiences with comparable systems, brainstorm sessions, et cetera. In addition, formal techniques for systematically identifying undesired events exist, such as Failure Modes and Effects Analysis.
3. Quantitative Analysis#
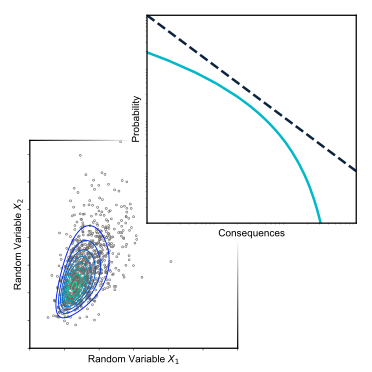
The probabilities and consequences of the undesired events identified in step 2 are quantified in this step, and risk is quantified in as expected damage(s) or with a risk graph as described in the next Section.
Probability#
In simple cases the probability can be computed directly, but generally the undesired event must broken down into multiple steps or processes to facilitate the computation of probability, which are then recombined using integration or the total probability theorem. Such an approach results in systems of systems, each of which is composed of individual components (or elements), each of which is typically evaluated using the limit state concepts defined above. Often this the probability of a limit state being exceeded is referred to as the probability of failure, which of course reflects the component, not necessarily the system. Techniques for computing the probability of failure are covered in the Component Reliability and System Reliability Chapters.
Whereas the most critical aspect of the previous step is identifying the most important failure modes, in the quantitative analysis it is critical to precisely define the quantity of interest, as ambiguity can lead to misunderstandings and incorrect assessment of risk. Often such ambiguities have a direct relationship with the conditional terms used inthe probability computations, which imply specific statements about dependence (or independence). Consider the previous example of river level exceeding the dike height \(P(h_w>h_{dike})\): the probability can be significantly different if a design lifetime of one year or fifty years is considered. In addition, the time of year may also play a role as different types of floods may occur. If the seasonal probability of flooding is binary and mutually exclusive with wet and dry season each lasting 6 months of the year, the following expression holds (all values computed an a per year basis):
Thus, if the risk analysis were only focusing on floods during the wet season, the probability of flooding would be overestimated by a factor on the order of 2 (assuming the probability is roughly equal in dry and wet seasons).
Consequences#
After failure has been defined, consequences of the events are quantified. First, physical effects associated with an undesired event are considered, sucha s heat and/or smoke from a fire, or inflow of water due to dike breach. Depending on the exposure of people or objects to the physical effects, damages, life loss or other impacts may occur. As an example, a specific consequence, \(D\), of dike failure during a flood is considered as a sequence of three discrete events:
The probability that a dike fails, \(P(E_{1})\)
The conditional probability that water flows into the polder given a dike breach \(P(E_{2}|E_{1})\)
The probability of damage given dike breach and inflow into the polder \(P(D|E_{1}\cap E_{2})\)
The probability of damage can now be computed by combining these terms:
which is analagous to the hazard, vulnerability and exposure formulation of risk introduced in the previous Section.
Multiple types of consequences can be caused by one disaster, which are illustrated in Table 3 for the failure of a flood protection system. The damage is divided into tangible and intangible damage, depending on whether or not the losses can be assessed in monetary values. Another distinction is made between the direct damage, caused by physical effects of the event, and damages occurring outside the directly exposed area. The latter occurs when companies outside an impacted area experience damages, due to loss of demand from customers in the flooded area. In a risk analysis it is desirable to take into account a complete set of impacts; unfortunately many of the items from the table cannot be easily quantified, if at all, thus the quantitative analysis and risk evaluation are often focused on economic damages and life loss.
Tangible |
Intangible |
|
|---|---|---|
Direct |
||
Residences |
Fatalities |
|
Structure inventory |
Injuries |
|
Vehicles |
Animals |
|
Agriculture |
Utilities and communication |
|
Infrastructure and other public facilities |
Historical and cultural losses |
|
Business interruption |
Environmental losses |
|
Evacuation and rescue operations |
||
Reconstruction of flood defences |
||
Clean up costs |
||
Indirect |
||
Damage for companies outside the exposed area |
Societal disruption |
|
Substitution of production outside the area |
Damage to government |
|
Temporary housing of evacuees |
4. Risk Evaluation#
In the risk evaluation phase a decision is made whether the risk is acceptable or not and whether risk reduction measures should be implemented. In other words, a direct answer is sought to the question “how safe is safe enough?” (Starr, 1967). Results of the quantitative analysis provide input for risk evaluation and decision making, and different quantitative approaches can be used to support risk evaluation, which are outlined here and introduced formally in the Risk Evaluation Chapter.
Decision Analysis: Also called ‘decision making under uncertainty,’ this approach aids the decision-making process by recording different possible outcomes along with the associated risks, costs and benefits, leading to the optimal selection from a number of alternatives. Often visual tools are used such as a risk matrix or decision tree.
Cost Benefit Analysis: costs and benefits of risk reduction measures are considered. When a large number of design choices are possible, an economic optimization can be applied to select an optimal system design, based on the costs and benefits of risk reduction.
Safety Standards: risk is compared with predetermined safety standards to directly determin acceptability. Such standards are typically imposed by government organizations or standards of practice and often focus on loss of life as the primary risk metric.
Given the nature of the key question “how safe is safe enough?”, several political, psychological and social processes play a role in the evaluation of risk—in other words: risk evaluation is not purely a technical process, but involves many subjective elements and decisions. One difficulty facing regulators is that preferences and risk attitudes within society may diverge and that costs and benefits may not be distributed evenly, and that a single, collective decision has to be based on strongly divergent individual preferences. In practice, this implies that the establishment of collective decision making procedures is inevitably a political process. This ambiguity can also be found in the numerous interpretations of “the” precautionary principle, which is interpreted by some as a decision making criterion that requires proof of harmlessness (a scientific impossibility), whereas it is seen by others as a decision making procedure that puts emphasis on dialogue and stakeholder involvement, (e.g. Jongejan (2008)).
5. Risk Reduction and Risk Control#
If the risks evaluated in first four steps of a risk analysis are considered unacceptable, several forms of risk reduction can be implemented, such as changes to the engineered system, or changes to its organization and management. It can be helpful to determine how risk can be controlled, for example by monitoring, inspection or maintenance.
Post-accident analysis indicates that human and organizational errors are still a major cause of failure in civil engineering systems, and it seems that the only suitable way to reduce human errors is by the incorporation of sufficient control in different phases of the construction process (Taerwe, 1986), and by a thorough education of all personnel involved. Therefore, an extensive interaction between the safety methodology and quality management is a necessity in order to guarantee the safety of infrastructure.