Sample Exam Questions#
General Questions#
Question 1: Indicate which of the following statements is true (multiple answers possible):
A parallel system gets stronger if there is a strong positive correlation between failure of the elements.
Dependence between elements is only determined by dependence in loads.
In case of a full dependence between two elements \(A\) and \(B\), it holds that \(P(B|A)=1\).
A flood defence system that is a single line of defence composed of multiple dike sections would best be characterized as a series sytem, not as a parallel system.
A prison with multiple walls and fences would best be characterized as a series system, not as a parallel system.
Answer
Options 3 and 4 are true.
Flood Protection for a Bay#
A flood protection system for an area at a bay consists of a first line of defence (a dam on the coast) and a second line (a dike around the bay) to protect the city against a storm surge that can cause a high water level in the bay. The design team considers two strategies: 1) a single dike around the bay, or 2) a dike around the bay plus a dam (see figure).

Question 1: from the perspective of flooding in the city, the function of the dam and dike together is best described as a (choose one): a. series system b. parallel system c. a single component d. none of the above
Answer
Option b is true.
Question 2: how will dependence between the dam and dike change the system failure probability? (choose one) a. increase b. decrease c. no change
Answer
Option a is true.
Question 3: describe whether or not there is dependence between the dam and dike, and what the source could be.
Answer
It is likely that both structures are constructed of the same material (e.g., local soil), which would respond in a similar way to the storm surge and waves. The structures are also likely to be operated and maintained by the same government agency, which would result in dependence due to human error and maintenance problems.
The damage in case of flood protection system failure is 1 billion \(10^9\) Euros. We compare two different investments in the system. In strategy 1 the system failure probability becomes \(10^{-3}\) per year at a cost of 10 million (\(10 \cdot 10^{6}\)). In strategy 2 the system failure probability becomes \(3 \cdot 10^{-4}\) per year at a cost of 50 million.
Question 4: for which value of the interest rate \(r\) is strategy 2 the most interesting? (You may consider an infinite lifetime of investments).
Answer
Find \(r\) such that the difference in expected damage between strategy 1 and 2, \(\Delta p_{f,sys}D/r\), is greater than the difference between the investments, \(I_2-I_1\), where the net present value over an infinite lifetime is \(1/r\).
Can also set up as solving for \(r\) when comparing total costs:
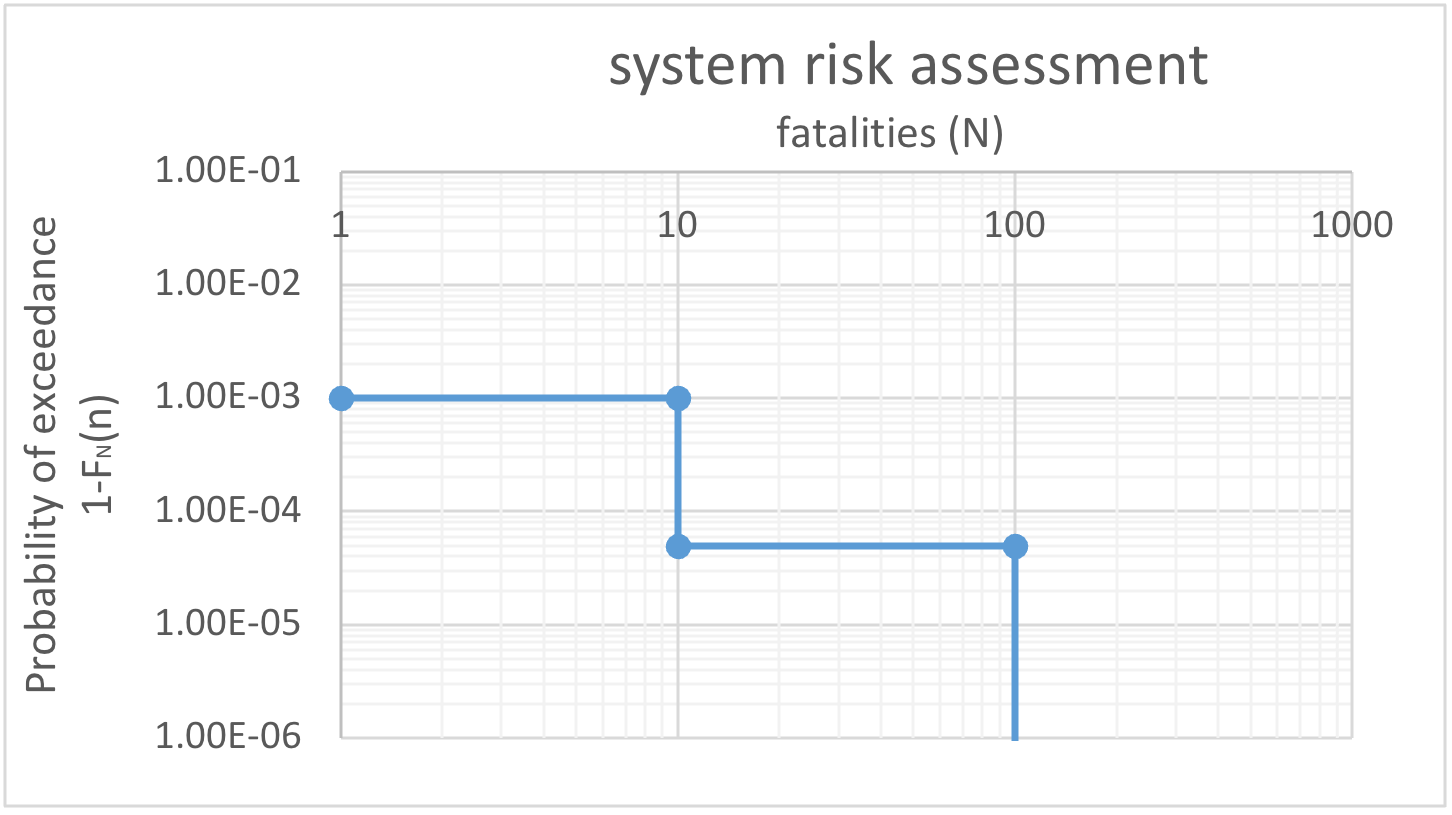
A full scale risk assessment is made for the system with probabilities \(P(N>10)=10^{-3}\) per year and \(P(N>100)=5 \cdot 10^{-5}\) per year. A so-called limit line is given with values with \(C = 10^{-1}\); and \(\alpha = 2\).
Question 5: determine whether this situation is acceptable. You may answer using a few sentences, calculations or by submitting a sketch, but either way, you must support your answer quantitatively. If you use a sketch, indicate the scale and relevant points on the plot.
Answer
First create an FN curve for the risk assessment
NOTE: the figure below is slightly incorrect; the horizontal lines should be to the right of the “dots;” in other words, the 1E-05 value should be above N=100. This makes it more obvious why the system does not meet the safety criteria.

Next, check that each point on the line is below the limit line:
The probability of exceeding 100 fatalities is too high since \(5E-5>0.1/100^2=1E-5\). The same is true for 10 fatalities.
The flooding probability is 1/50 per year and damage is 150 million € (\(10^6\)). It is questioned whether additional protection is needed and what would be the best solution between the following:
Strategy A: raise the dike
Strategy B: raise the dike and build a mangrove forest in front which reduces waves
The table below indicates the costs of the strategies and how much they reduce the initial failure probability. Assume the interest rate is 4%.
Strategy |
Failure probability factor |
Costs, million € (\(10^6\)) |
|---|---|---|
Do Nothing |
1.0 |
0 |
A |
0.5 |
10 |
B |
0.2 |
18 |
Question 6: what is the most cost-effective or optimal strategy? Explain your answer.
Strategy A
Strategy B
neither A nor B
Answer
Strategy B is best.
Various costs (NPV value) are calculated in the table below, and Strategy B is the lowest total cost we well as highest risk reduction.

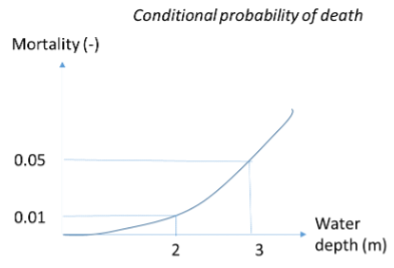
Consider the individual risk in two areas of the city by the bay, above. The acceptable individual risk is \(10^{-5}\) per year. The conditional probability of death due to flooding is dependent on the water depth and indicated next to the graph. The individual risk level in area A is \(10^{-5}\) per year and the water depth is 3 m. The individual risk level in area B is \(10^{-5}\) per year and the water depth is 2 m.
Question 7: what should be the maximum allowable failure probability of the dike on the bay, \(P_{\text{flooding}}\), to meet the standard for individual risk, \(IR\)?

Answer
Individual risk is:
where the values for the conditional term can be found using the mortality figure, and solve for \(P_{\text{flooding}}\).

The norm is governed by the most strict safety requirement, thus, \(P_{\text{flooding}}\) should be 0.0002 per year.
Component Reliability#
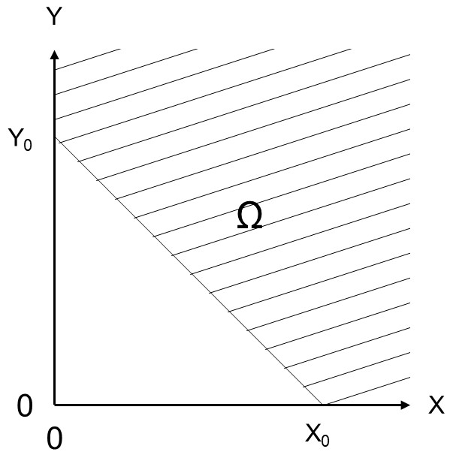
The shaded region, \(\Omega\), in the figure below is the failure domain of an unknown object (the shaded zone extends further towards positive infinity for \(x\) and \(y\)). \(p_f\) is the probability of failure of that object, such that:
Where \(x\) and \(y\) are random variables and \(f(x,y)\) is the joint PDF.

Question 1: identify a specific real-life object of your choosing (it can be anything!) that can be described by this diagram and failure probability. Describe the object and provide a definition of failure using words only, no equations. Mention whether \(X\) and \(Y\) each acts as a load or a resistance.
Answer
It is clear that \(X\) and \(Y\) are both loads, since high values of both variables lead to failure. There are many possible ‘objects’ that are governed by two loads:
Dike: x and y are water level and wave load, failure is excessive overtopping
Steel rod: 2 loads exceed strength
Beam: self-weight and length are loads (but this is non-linear)
Island: x and y are sea level rise and settlement, capacity is elevation; failure is flooding
2 things on object with limiting capacity. E.g.: people on a couch or bench, birds on a tree branch
Literally any two loads would be acceptable, as long as the capacity of the object was a sum of both of them (if not a sum, it’s non-linear)
