Paint System#
In this assignment we will consider a paint system that prevents rust and corrosion on a steel structure. A high quality paint system costs €40 per square meter and has a failure probability of 0.002, which assumes that the old paint system is completely stripped off and the steel surface is cleaned prior to installation, which has an additional cost of €20 per square meter.
Common cost cutting measures are to use a cheaper paint that costs half as much, but is five times more likely to fail, or to simply sand the old paint rather than stripping it off prior to applying a new paint, which increases the failure probability by 10, but only costs €5 per square meter.
During operation of the structure, if a rust spot is found it must be repaired immediately by removing the damaged paint and replacing it. The repair has an additional cost of €500 per square meter.
Construct a decision tree to evaluate the different options for steel preparation and paint, then use it to answer the following questions. Assume that the owner wants to minimize total costs, that the paint system only fails once in any reference period and that the probability of failure in each year is independent. All costs and probabilities are calculated on a square meter basis.
Decision Tree
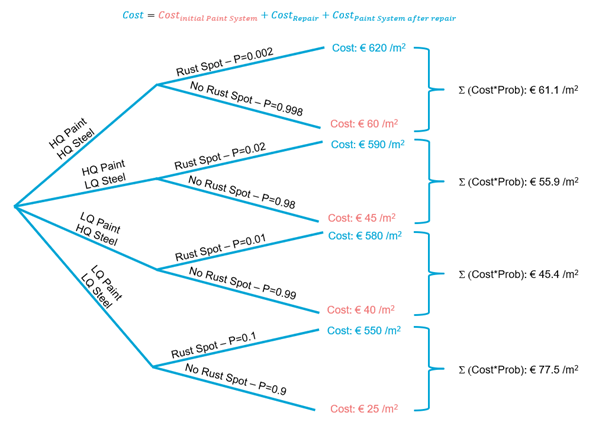
This problem can be visualized using a decision tree as shown below. However, it results in a different interpretation of the problem than that shown in the solution. For example, consider the top branch at the far right, where ‘No rust spot’ is assigned a probability of 0.998. This is consistent with the formulation of a decision tree, but not consistent with the problem statement, which implies that the €60 cost associated with cleaning and painting is always done when replacing the paint system (thus a probability of 1.0). This is why the values in the decision tree are slightly different than those in Question 3, for example.
Although the decision tree is not part of the exam, this illustrates an important lesson: it is very easy to accidentally make probability calculations that are inconsistent with the situation you are trying to evaluate!

Fig. 36 Decision tree.#
Question 1: What is the probability of each paint system failure per square meter over one year?
Answer
Paint |
Cleaning |
\(p_f\) [1/yr] |
|---|---|---|
High-Quality |
Stripping |
0.002 |
High-Quality |
Sanding |
0.02 |
Low-Quality |
Stripping |
0.01 |
Low-Quality |
Sanding |
0.10 |
Question 2: What is the probability of each paint system failure per square meter over a 10 year period?
Answer
Paint |
Cleaning |
\(p_f\) [1/10-yr] |
|---|---|---|
High-Quality |
Stripping |
0.02 |
High-Quality |
Sanding |
0.18 |
Low-Quality |
Stripping |
0.10 |
Low-Quality |
Sanding |
0.65 |
Question 3: What is the expected cost per square meter over a one year period if the owner uses the high quality cleaning and high quality paint?
Answer
Question 4: What is the optimal paint system for a one year period?
Answer
Paint |
Cleaning |
Expected cost [€/yr] |
|---|---|---|
High-Quality |
Stripping |
61.12 |
High-Quality |
Sanding |
55.90 |
Low-Quality |
Stripping |
45.40 |
Low-Quality |
Sanding |
77.50 |
Low Quality Paint + High Quality Cleaning
Question 5: What is the optimal paint system for a 10 year period?
Answer
Paint |
Cleaning |
Expected cost [€/10 yr] |
|---|---|---|
High-Quality |
Stripping |
71.10 |
High-Quality |
Sanding |
144.70 |
Low-Quality |
Stripping |
91.63 |
Low-Quality |
Sanding |
366.94 |
High Quality Paint + High Quality Cleaning
NOTE: If you’re getting slightly different results, don’t panic! Most likely you have approximated the probabilities computed above in question 2.
Assume the owner has decided to use the cheap paint system, and is simply going to sand it off (i.e. the cheap cleaning method) and re-apply the same system every year (i.e., for these problems consider a 1-year reference period). You have been asked to assess whether it is worthwhile to use a quick sonic test system to prevent failures during the year, and if it is, the number of tests that should be performed per year. Each test costs about €3 per m2, and if a weak spot is found, a new layer of paint can be easily applied, lowering the failure probability by a factor of 0.50.
Question 6: What is the annual expected cost due to paint failure if no sonic inspections are done?
Answer
Question 7: What is the annual expected total cost for the paint system if no sonic inspections are done?
Answer
Using the decision tree from above: €77.50/m2
Question 8: What is the change in risk for 3 sonic inspections?
Answer
Question 9: What is the annual expected cost due to paint failure if 3 sonic inspections are done?
Answer
The expected damage is: $\( E(D)=P_f \cdot D={0.5}^3 \cdot 0.1 \cdot 525=6.56 \)$ But the 3 inspections cost €9, thus the total expected cost is €15.56. It is incorrect to multiply the inspection cost by the failure probability. NB: this calculation implies the inspections occur regardles of when the failure happens.
Question 10: What is the maximum number of inspections per year that can be performed that are cost-effective? Note: Round your answer towards the smallest integer.
Answer
For the investments to be cost effective:
Which results in a maximum of 17 inspections per year.
Question 11: What is the optimum number of sonic inspections to perform each year? Plot a graph, with the Risk, Investment and Total cost curves and clearly indicate the optimum.
Answer
As shown in the figure, the optimum is 3 per year.

Fig. 37 Optimization curve for exercise 12#
