Advanced Optical Microscopes#
Many attempts have been and are still being done to achieve better images. An obvious way of improving the resolution is to use shorter wavelengths. However, at wavelengths below 200 nm (i.e. at deep, extreme ultraviolet, soft x-rays and hard x-rays) most materials have low optical contrast and refractive optics (lenses) are not practical. Instead of reducing the wavelength, other methods have been invented to achieve higher resolution. Some of these (certainly not all) are discussed in this chapter. Apart from these already existing systems, research is continuing to achieve higher resolution. Pendry’s paper on a superlens based on negative refraction[1] has started a very active research on super-resolution using metamaterials, in particular hyperbolic materials. We will not go into these topics here and instead refer interested students to the master course Advanced Photonics.
Phase Contrast Microscope#
Suppose we have a pure phase object \(U_0(x,y)=e^{i\varphi(x,y)}\), i.e. an object that transmits light everywhere (a transparent object), but which shifts the phase of the light differently for different positions. An example of such objects are biological cells. Since only the intensity can be measured and since i \(|U(x,y)|^2=1\) it contains in this case no meaningful information. To obtain an image the field must be manipulated such that phase information is converted into amplitude information. If \(\varphi(x,y)\) is small, we can show that this can be done by Fourier transforming \(U(x,y)\), shifting the phase of the Fourier transform in the point \((k_x,k_y)=(0,0)\) by \(\pi/2\), and inverting the Fourier transform. Shifting the Fourier transform of \(U(x,y)\) in \((0,0)\) gives
This shift can be realised with a phase mask in the pupil of the lens. Inverse Fourier transforming gives
This is the field in the image focal plane of the lens. Its intensity is
where we assume without loss of generality that \(\mathcal{F}(U)(0,0)\) is real (a constant phase shift can be chosen such that \(\mathcal{F}(U)(0,0)\) is real). We see that indeed the phase information can now be measured as intensity information, because of the phase shift applied to the Fourier transform of \(U(x,y)\) in one point[2]. Assuming that \(\varphi(x,y)\) is small, and neglecting the higher-order term \(\hat{U}(0,0)^2\), we can write
Phase contrast microscopy requires thin samples.
Confocal Microscope#
A confocal microscope is a optical microscope which is able to record images with a very small depth of focus (~400 nm). By translating the focal plane through the object, it is possible to get a 3D representation of the object. A computer is then needed for the reconstruction. The technique is shown in Fig. 130, extracted from the patent filed by Minsky in 1957.
The idea is to illuminate the object with a tightly focused spot, using an objective lens. The object reflects the laser spot and the reflected light is imaged by the same objective. A small pinhole is put in front of the detector in the image plane. The spot is scanned laterally and the total image is obtained by processing all the images for all the lateral scan positions. As is illustrated in Fig. 130, by using a focused spot for the illumination in conjunction with a pinhole in front of the detector, only the photons very close to the focal plane pass the pinhole and are detected. This means that the axial resolution of the images is roughly 600 nm when light of wavelength of 400 nm is used, which is better than with bright field illumination and conventional detection. The illumination by a focused spot implies that the sample is illuminated by a field with large lateral spatial frequencies. Because the reflected near field is the product of the incident spot and the reflection function, high spatial frequencies of the reflection function can be transmitted by the lens, due to the convolution in the Fourier domain between the Fourier-transformed incident spot and the transformed reflection function. The lateral resolution is therefore also increased from around 200 nm to 160 nm, i.e. by a factor around 1.2. The confocal microscope thus gives higher resolution both in the axial and in the lateral direction. It can of course only be applied to an object that does not change during the time required to scan.
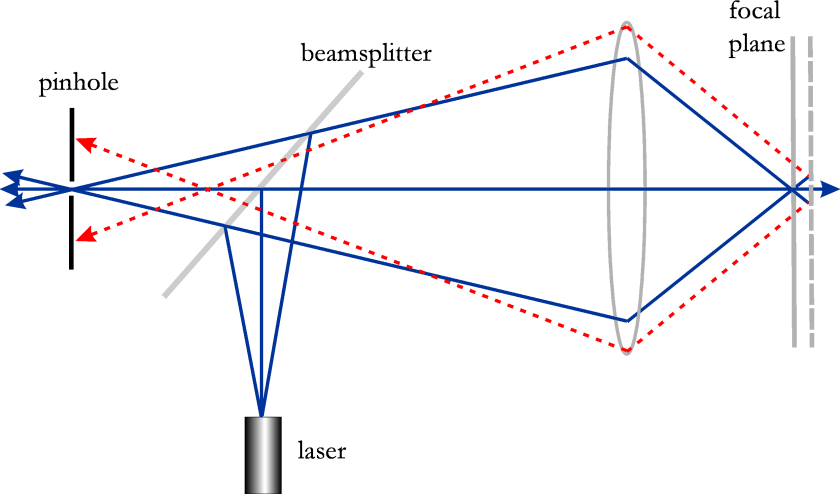
Fig. 130 Schematic of a confocal microscope and its principle#
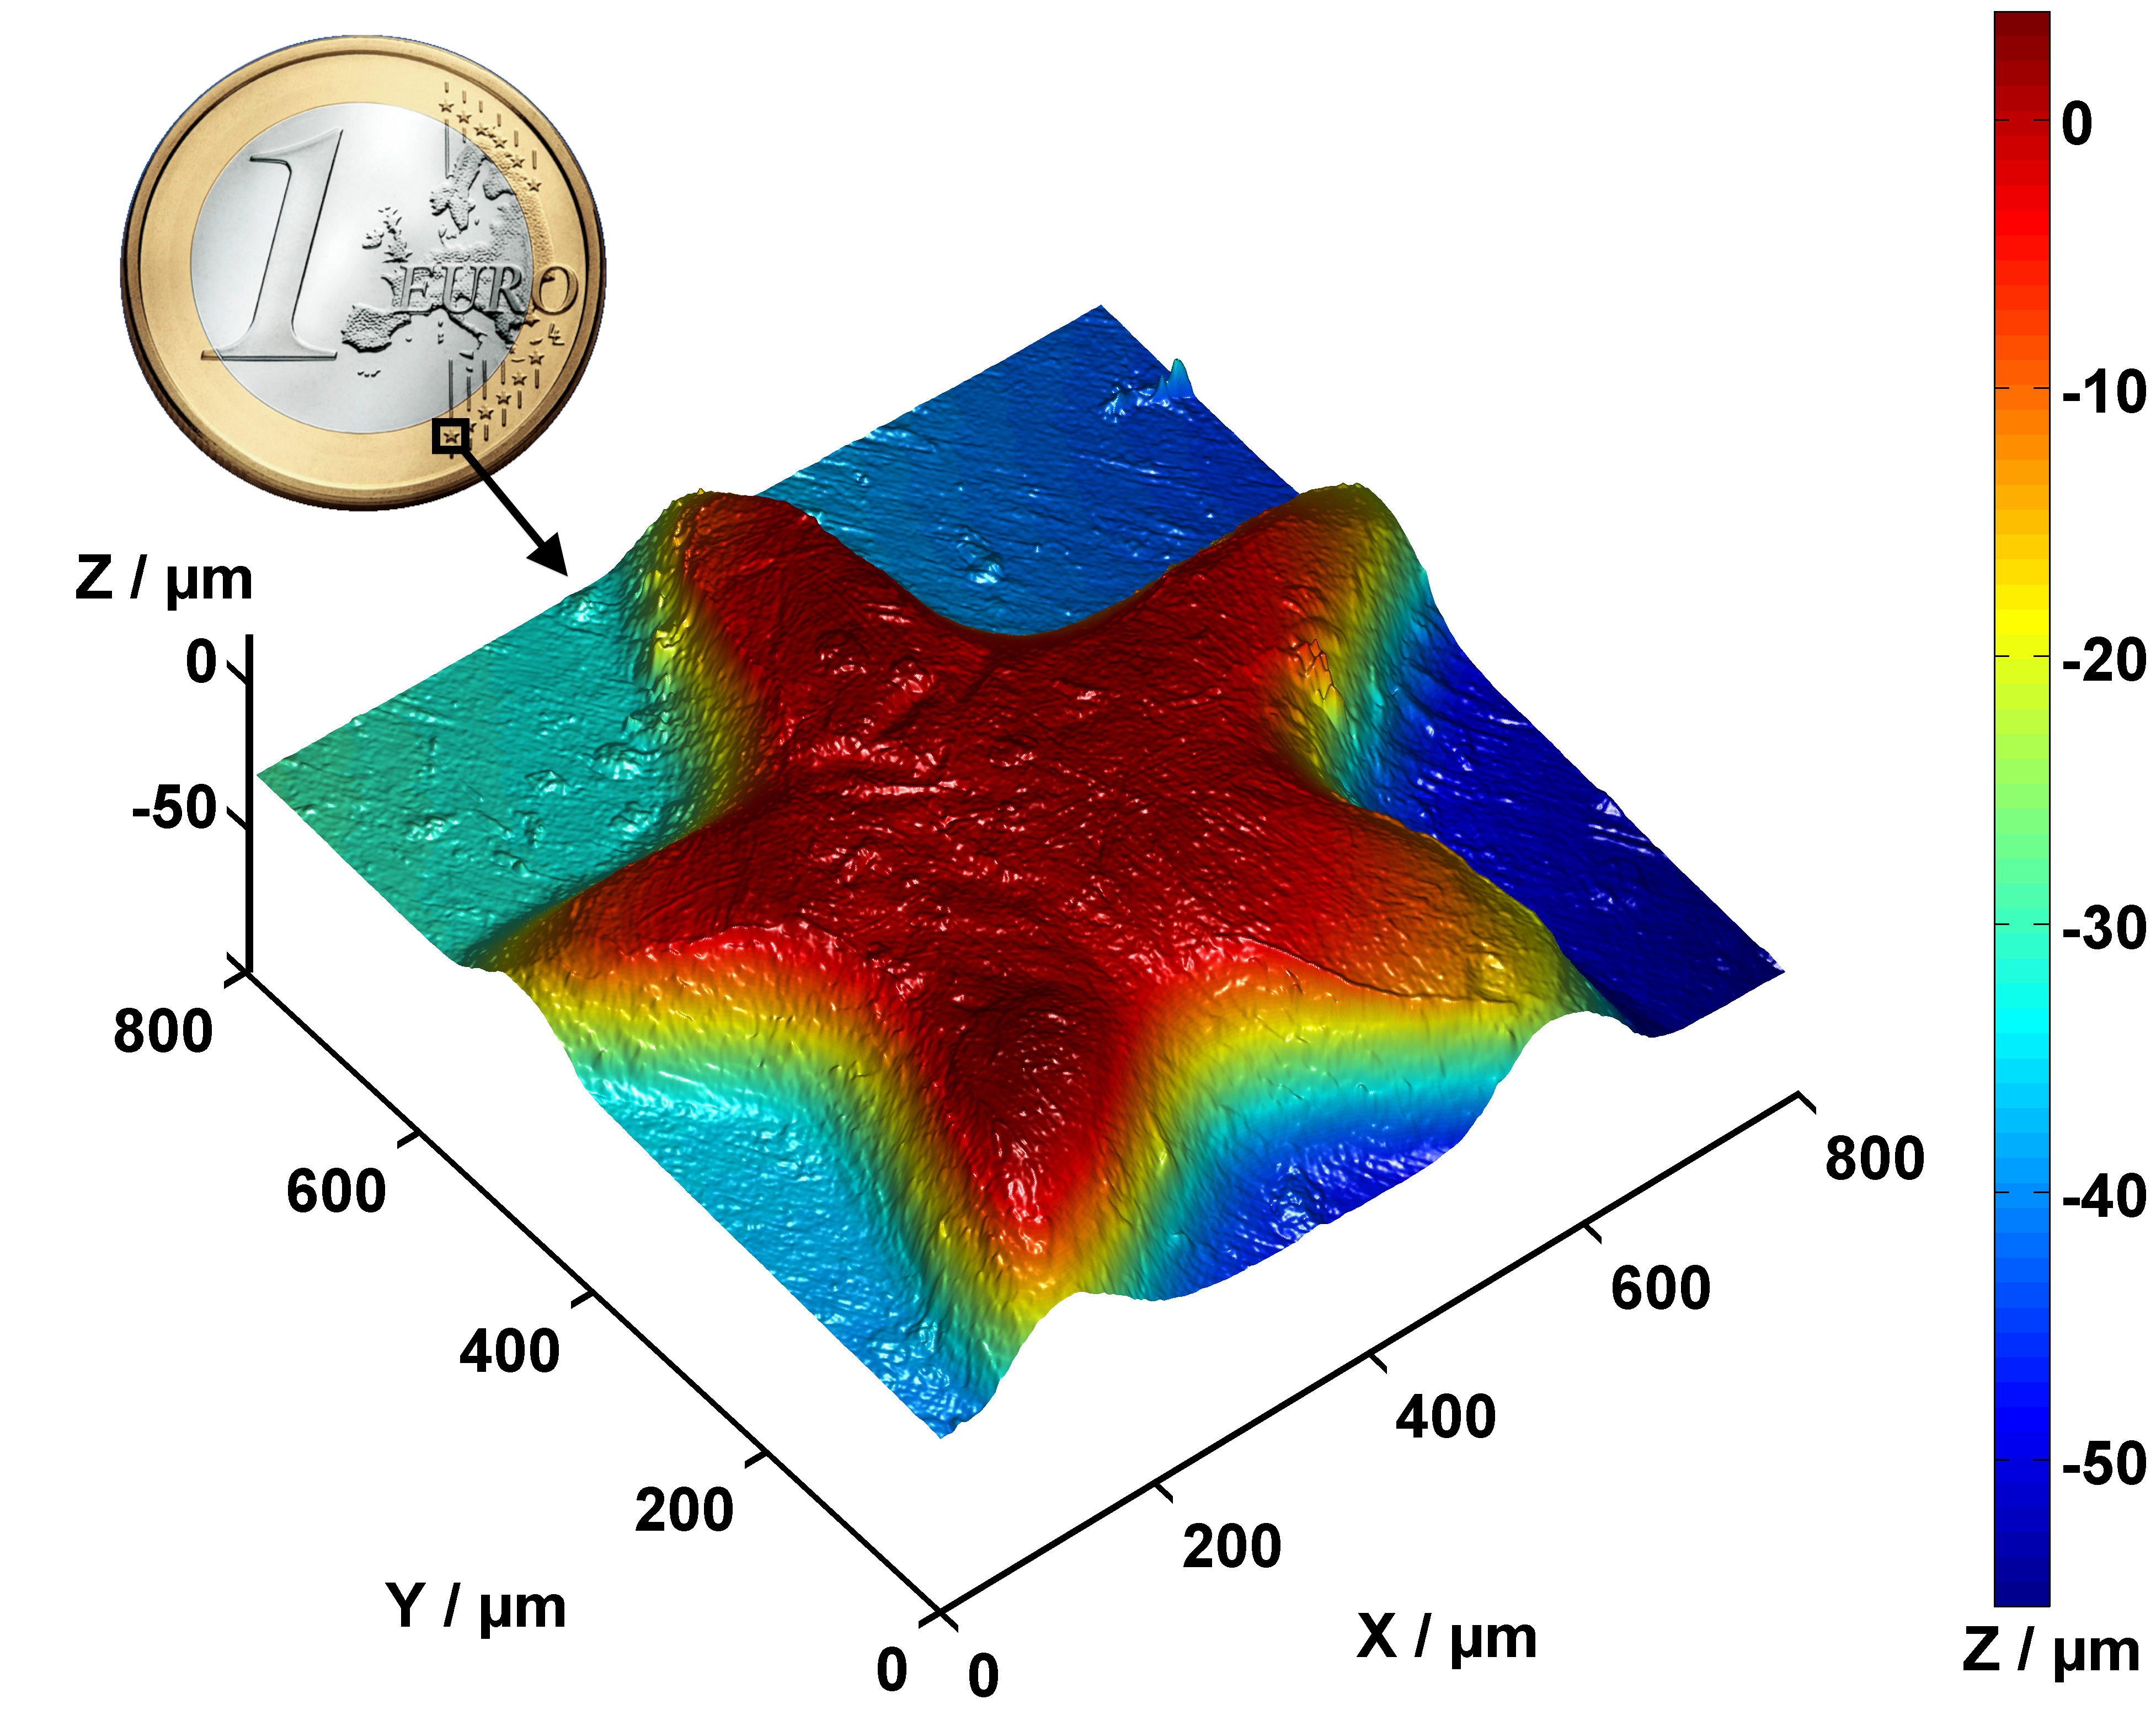
Fig. 131 Partial surface profile of a 1 Euro coin, measured with a Nipkow disk confocal microscope. Source Wikipedia#
Fluorescence Microscope#
In this case, fluorescent molecules, such at those of the GFP (Green Fluorescence Protein) family, are introduced in the cell of interest. The light from the illuminating source is monochromatic (laser) and excites these GFP molecules which then re-emit at a characteristic longer wavelength. By using a dichromate (a mirror that passes only a certain colour and reflects the rest), this re-emitted light can be detected using a detector with a pinhole. One obtains colourful images such as the one presented in Fig. 132. The advantage of fluorescence microscopy is that the sources of the fluorescence light are inside the sample and that by selective binding of the fluorescent molecules to particular organs very specific images can be obtained.
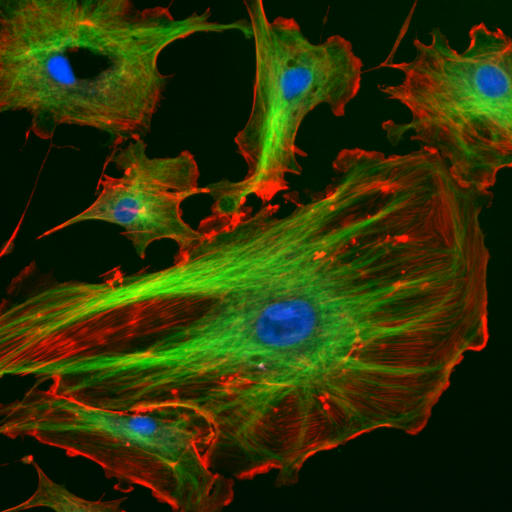
Fig. 132 Endothelial cells under the microscope using fluorescence microscopy. The different colours enlighten different GFP.#
Scanning Near-Field Optical Microscope#
As we have discussed earlier, when an object is illuminated, high spatial frequency components of the transmitted and reflected near field which contains information about sub-wavelength features cannot reach the detector in far field microscopy, because the waves corresponding to high spatial frequencies are evanescent. This implies that features smaller than the wavelength cannot be detected using conventional far field microscopy. By putting a high refractive index fluid such as oil between the sample and the objective lens, the effective wavelength is reduced by the refractive index and hence the resolution is improved. This is called immersion microscopy.
But to achieve superresolution, i.e. the detection of features that are substantially below the wavelength, it is necessary that the information contained in at least part of the evanescent waves is in some way detected. This is done in a SNOM (Scanning Near-Field Optical Microscope). There are two methods to achieve superresolution. The first method is illustrated at the left of Fig. 133. The sample is illuminated and the scattered field is detected using a sub-wavelength tip on a fiber that directs the locally scattered light to a detector. The sample is laterally scanned by the sub-wavelength tip, which is almost in contact with the sample and therefore is sensitive to sub-wavelength details in the scattered field.
The second method is shown at the right of Fig. 134. A fiber with sub-wavelength tip is now used to illuminate the sample from a very small distance, while the detection is done with a conventional objective. It may at first seem strange that the detected far field contains information about sub-wavelength features of the object and hence provides superresolution images. The superresolution is however due to the fact that the illumination consists in part of evanescent waves. The two set-ups in Fig. 133 are reciprocal to each other and they give similar resolution enhancement.
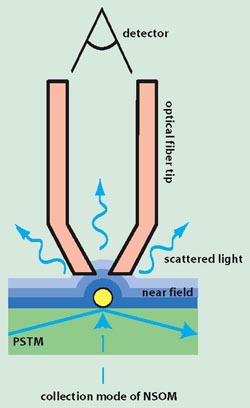
Fig. 133 Collection (left) and Excitation (right) mode for a SNOM.#
On the left in Fig. 134 a topographic Atomic Force Mircoscopic (AFM) image is shown of a Photonics Band Gap (PBG) structure; next to it is an NSOM image measured with a collecting fiber set-up.
A warning is appropriate. Because in SNOM the fiber is very close to the sample, either to illuminate the sample or to collect the scattered near field, the fiber in general will influence the measurement, i.e. the field that one wants to detect is to a certain extent perturbed by the measuring device.
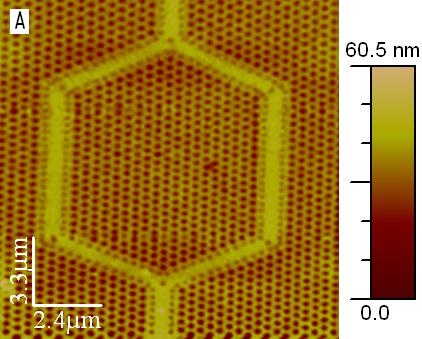
Fig. 134 Left: Topographic AFM image of a Photonics Band Gap (PBG) structure, imaged with a 150 nm AFM/NSOM cantilevered probe. Right: NSOM image of the PBG structure using 532 nm laser wavelength.#