13.1. Graphical environment#
To program biomolecular simulations, an essential first step is to learn how to use a graphical environment to draw particles on the screen.
The graphical environment may be thought of as a program that simulates the so-called penwriter (Fig. 13.1), which was used in the early days of computers to draw graphs or other outputs.
Currently, this has a new, more complex use in 3D printers.
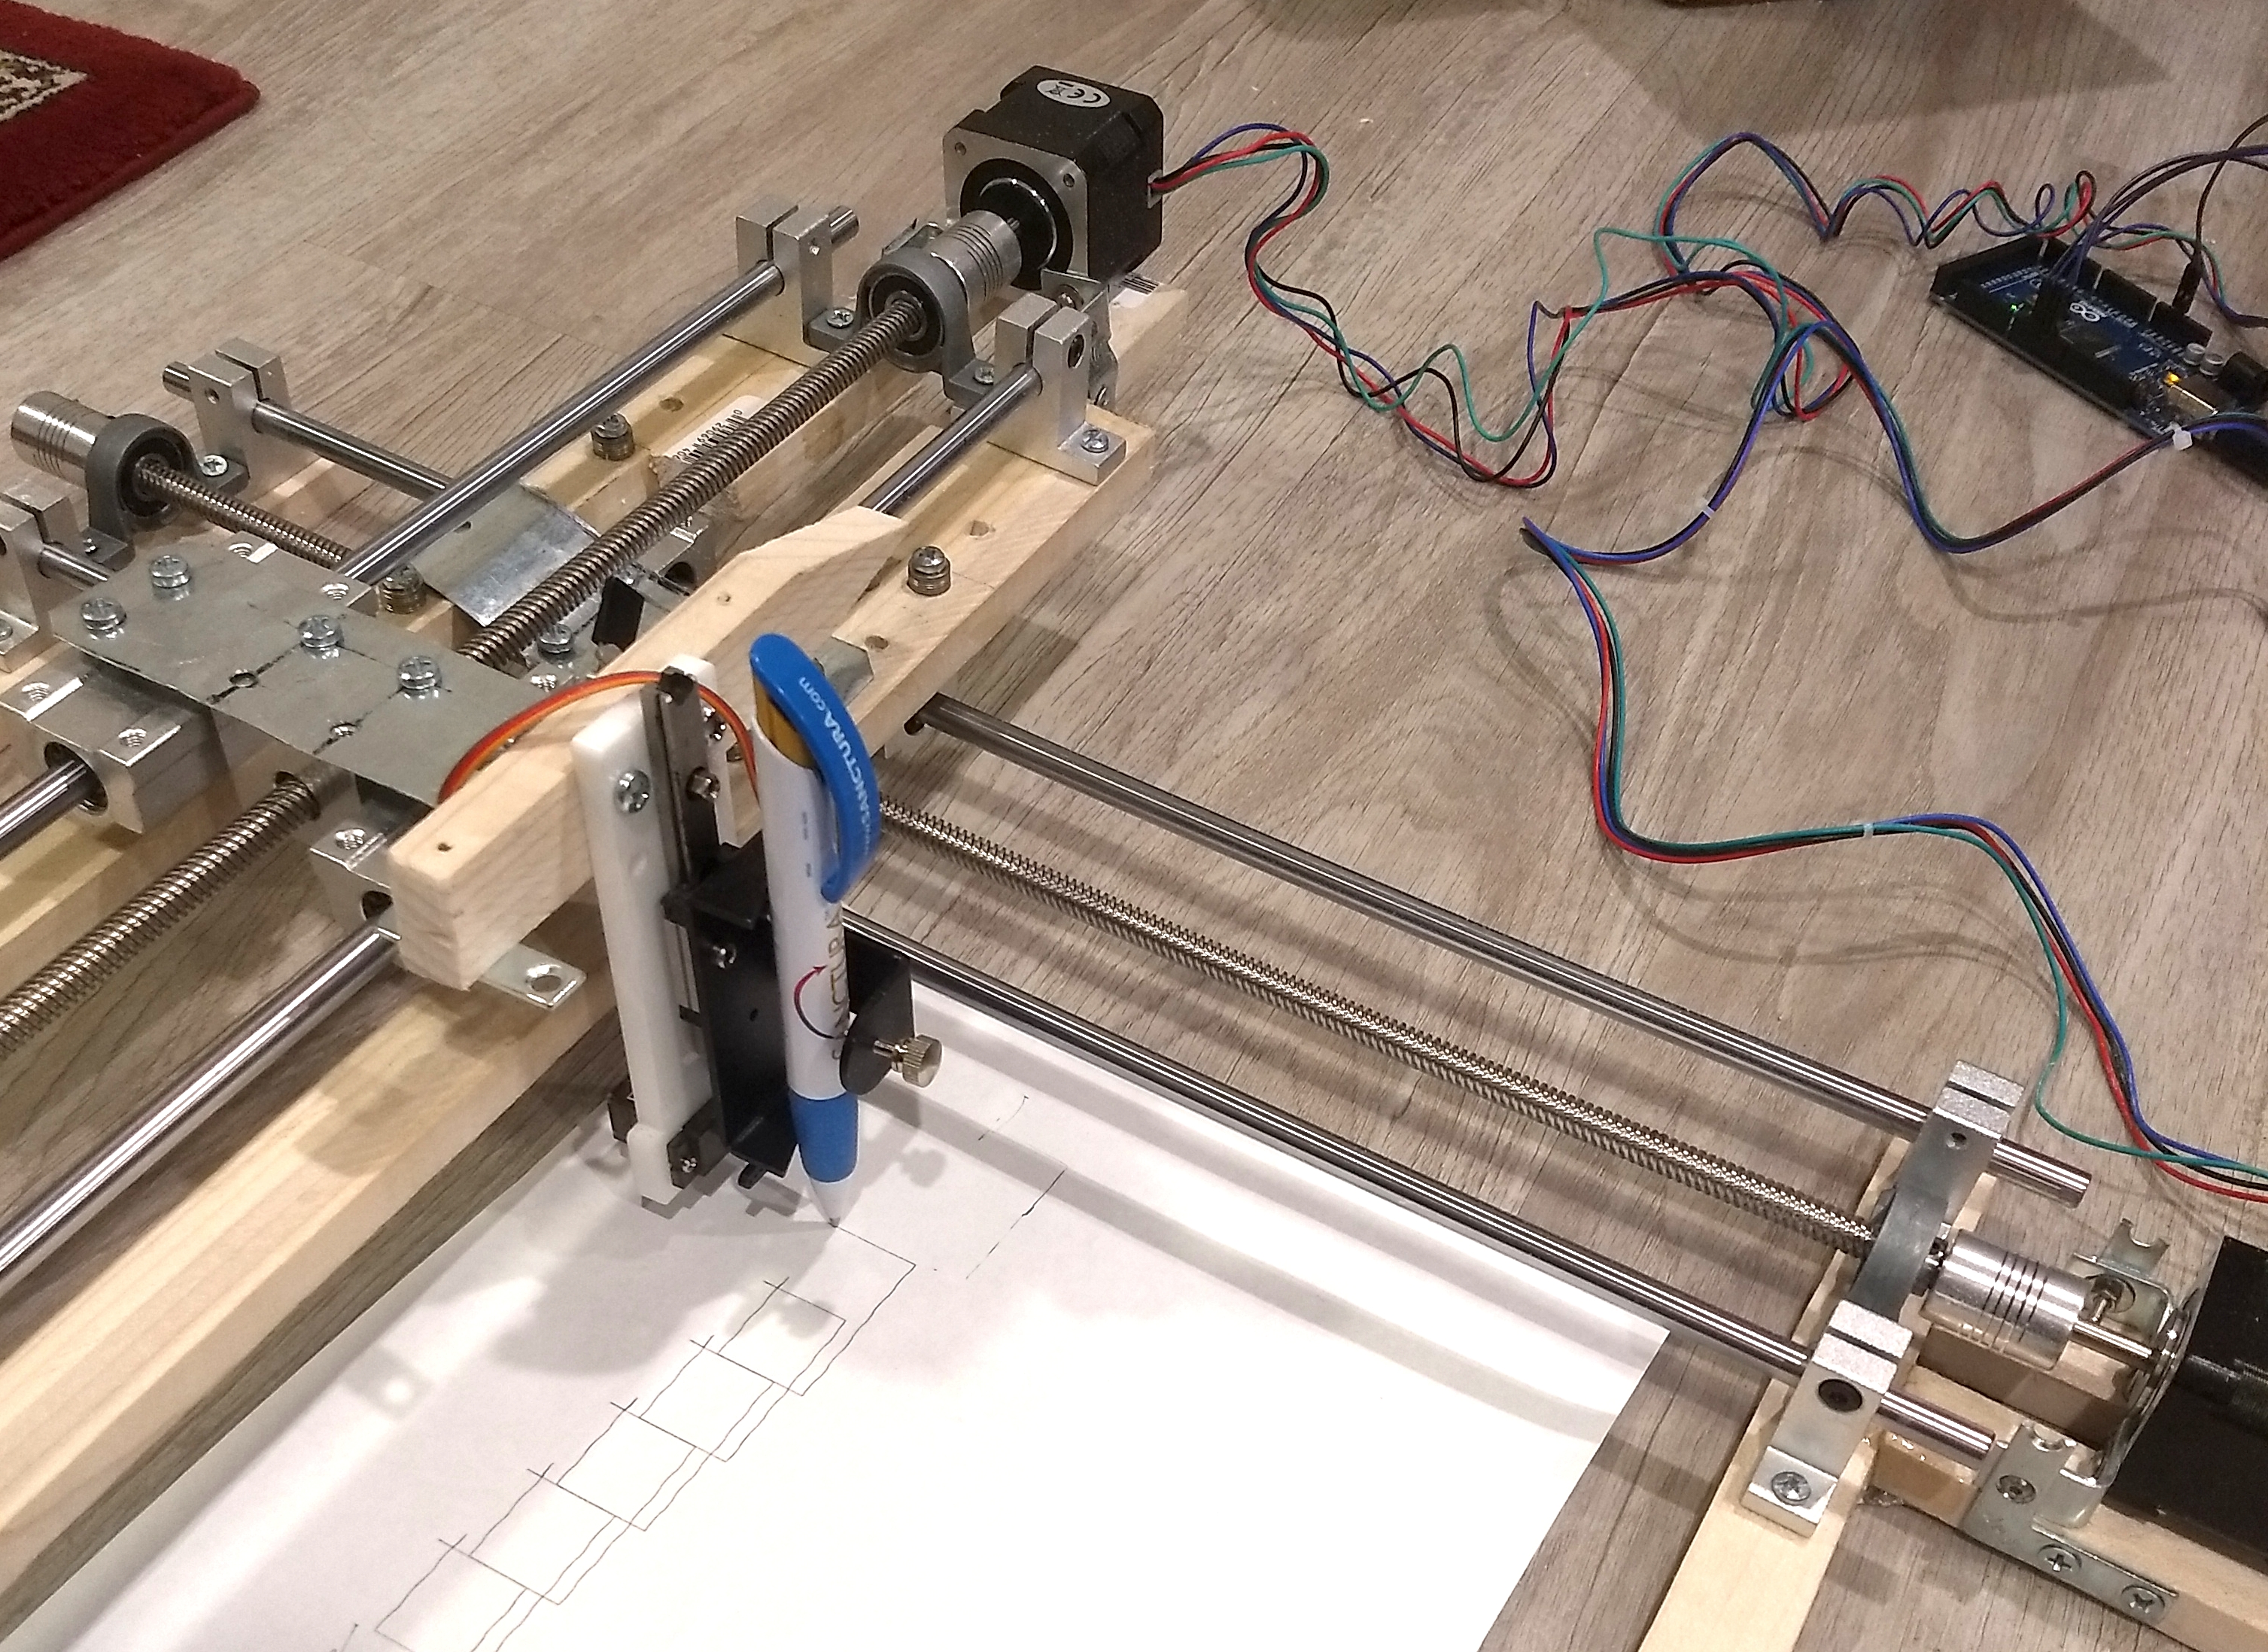
Fig. 13.1 The penwriter has a pen which can be moved by the computer in horizontal (x) and vertical (y)
directions. Different pens with different colours and sizes can be used to draw lines or dots on a sheet of paper placed in the device. Chiffre01, CC BY-SA 4.0, Wikimedia Commons
#
13.1.1. NaNoPy package#
For this course, a graphical Python package called NaNoPy was designed. To install this package, you first need to download it from this link and then install via pip using the following commands in your terminal (macOS/Linux) or Anaconda prompt (Windows):
conda activate pf-env
pip install [*add path where your downloaded package was saved*]/nanopy-1.5.42.tar.gz
Warning
Check extension
If your computer downloaded nanopy-1.5.42*.tar* instead of nanopy-1.5.42*.tar.gz* (the difference is in the file extension), you need to modify the pip install command accordingly.
This will install NaNoPy package and several other packages it depends on automatically.
To use the graphical environment, you will need to import the NaNoPy package in your Python scripts:
from NaNoPy import *
13.1.2. Using graphical environment#
13.1.2.1. Canvas: Graphical window#
As you want to make biomolecular simulations on your computer, the penwriter paper is effectively replaced by a graphical window of your computer. You can think of a graphical window as a canvas for drawing. To define a window that is 640 pixels wide and 360 pixels high, and carries the title “title” in the top bar of the screen, we use the following Python code:
xSize = 640
ySize = 360
screen = canvas("title", xSize, ySize)
With this code, the graphical window is stored in the variable named screen.
As you can see in the code, when declaring a graphical window, the horizontal (x) and vertical (y) sizes of the window need to be defined.
Optionally, two additional arguments can be added: xpos and ypos.
These arguments are the coordinates of the upper left corner of the window on your monitor.
E.g., the coordinates (xpos = 0, ypos = 0) will place your window in the top left corner of your monitor; as default, coordinates in which the graphical window is displayed is the middle of your screen.
13.1.2.2. Pen: Writer#
The writer, used for drawing, needs to be declared in a similar fashion to the graphical window. You can think of the writer as a pen with which you draw on a canvas.
To define a variable named pen, with the canvas on which it draws being the graphical window
screen as declared above, we write:
pen = writer(screen)
The pen can be used to draw a pixel of a specific colour on the screen, and takes three arguments:
pen.drawPixel(x, y, c)
The first two arguments are the x and y coordinates of the pixel. Notice that the (0, 0)
coordinate is the lower left corner of the screen. The third argument gives the colour (e.g.,
color().yellow).
13.1.2.3. Updating the screen#
For the drawings made with the writer function to be visualised in the graphical window, it is
necessary to update the screen and keep the window open when your program is finished. You can do this by using the following code:
screen.update()
screen.keepwindow()
These lines of code, together with the above graphical window and writer, allow you to execute a program that draws on the screen of your computer.
13.1.2.4. Example: Drawing a horizontal line#
Task: write a program that draws a vertical red line by using the writer’s drawPixel function.
from NaNoPy import *

xSize = 640
ySize = 360
screen = canvas("title", xSize, ySize)
pen = writer(screen)

y = ySize / 2

for x in range(xSize):
 pen.drawPixel(x, y, color().red)

screen.update()
screen.keepwindow()
AI note
As we just saw, in this chapter we are using a package called NaNoPy. Unlike numpy or pandas, this package is designed for this course and difficult to find online help or guidance. Similar to this package, there will be many other custom tools/packages that you will need to use in the future. Therefore, we suggest you to be especially critical while you get support from LLMs.
Exercise 13.1
First you can test if your LLM is aware of the package we will use: Do this by asking the AI about the NaNoPy package along with information on the writer() and canvas() functions. Compare the definition and input/output arguments given by your LLM against the definition of these functions in NaNoPy. You can see the NaNoPy definition of the functions by selecting the function’s name in the script, right-clicking and choosing “Go to definition”.