10.3. Debugging in VS Code#
When learning to program, debugging is an essential skill to master. Debugging allows you to step through your code to understand its behavior and identify where things go wrong.
So far, did debugging in our Python programming using print statements.
However, as you may have noticed, that way of searching for bugs includes changing your code (to add test print statements) and then altering your code again (by removing the test print statements) once you have identified and fixed the bug.
In this section, we will explore a more powerful way of debugging, using VS Code, which doesn’t include altering your code with print statements.
In this section, we will cover the basic debugging features in VS Code: breakpoints, single stepping, and viewing variables.
We also offer some additional reading on more advanced debugger features in VS Code.
The explanations and examples in this page are, therefore, also meant to be tried out in VS Code, which we encourage you to do.
10.3.1. Key terms#
Breakpoint: A point in your code where the program will pause execution, allowing you to inspect the current state and step through the following lines of code. Breakpoints are helpful when you know the area of the code where a bug might exist. You can place breakpoints around suspicious code blocks to pause the program at key points.
Single stepping: The process of moving through your code one line at a time to observe how each statement affects the program. Single stepping is useful when you need to observe the flow of your program in a fine-grained manner. Step through the code to ensure it executes as expected, and verify that each variable is set correctly.
Local and global variables: Local variables are those defined inside a function and are accessible only within that function. Global variables are defined outside of functions and are accessible from any part of the code. Viewing local and global variables is crucial for understanding the current state of your program. If the values are not what you expect, this can give you insight into potential bugs or logical errors. See also previous book section.
10.3.2. Best practices for debugging#
Start by placing breakpoints near the code where the error occurs. Gradually move breakpoints earlier in the code if the issue isn’t obvious.
Use single stepping to see if the flow of control is behaving as expected.
Continuously check the values of variables as you step through the program. If a variable holds an unexpected value, that’s often where the problem lies.
10.3.3. Prerequisites for effective debugging#
Before you begin a debugging session, it’s crucial to consider a few key questions that will save you time and frustration:
1. Can you recreate the bug?
The first and most important step in debugging is determining whether you can reproduce the bug consistently. A bug that cannot be recreated is extremely difficult to fix. Consider these factors:
Environment-specific bugs: Some bugs only occur with specific versions of Python or particular libraries
Data-dependent bugs: The bug might only manifest with certain input data or file types
System conditions: Issues may arise only under specific system loads or when other programs are running
2. Does it happen every time?
Even if you can recreate the conditions for a bug, it might not occur consistently. This is important to establish because:
You could spend hours debugging without the bug appearing in that particular session
The debugging process itself might interfere with the bug’s occurrence
Some bugs are sensitive to timing or system resources, e.g., heavy CPU load, low memory, or slow network
Best practice: Before starting an intensive debugging session, run your code multiple times under the same conditions to verify the bug’s consistency. Document the exact steps and conditions that trigger the bug.
10.3.4. Starting the debugging process#
10.3.4.1. Setting breakpoints#
To add a breakpoint in VS Code, hover over the area to the left of the line numbers. You’ll see a faint red dot appear, indicating where you can place a breakpoint.
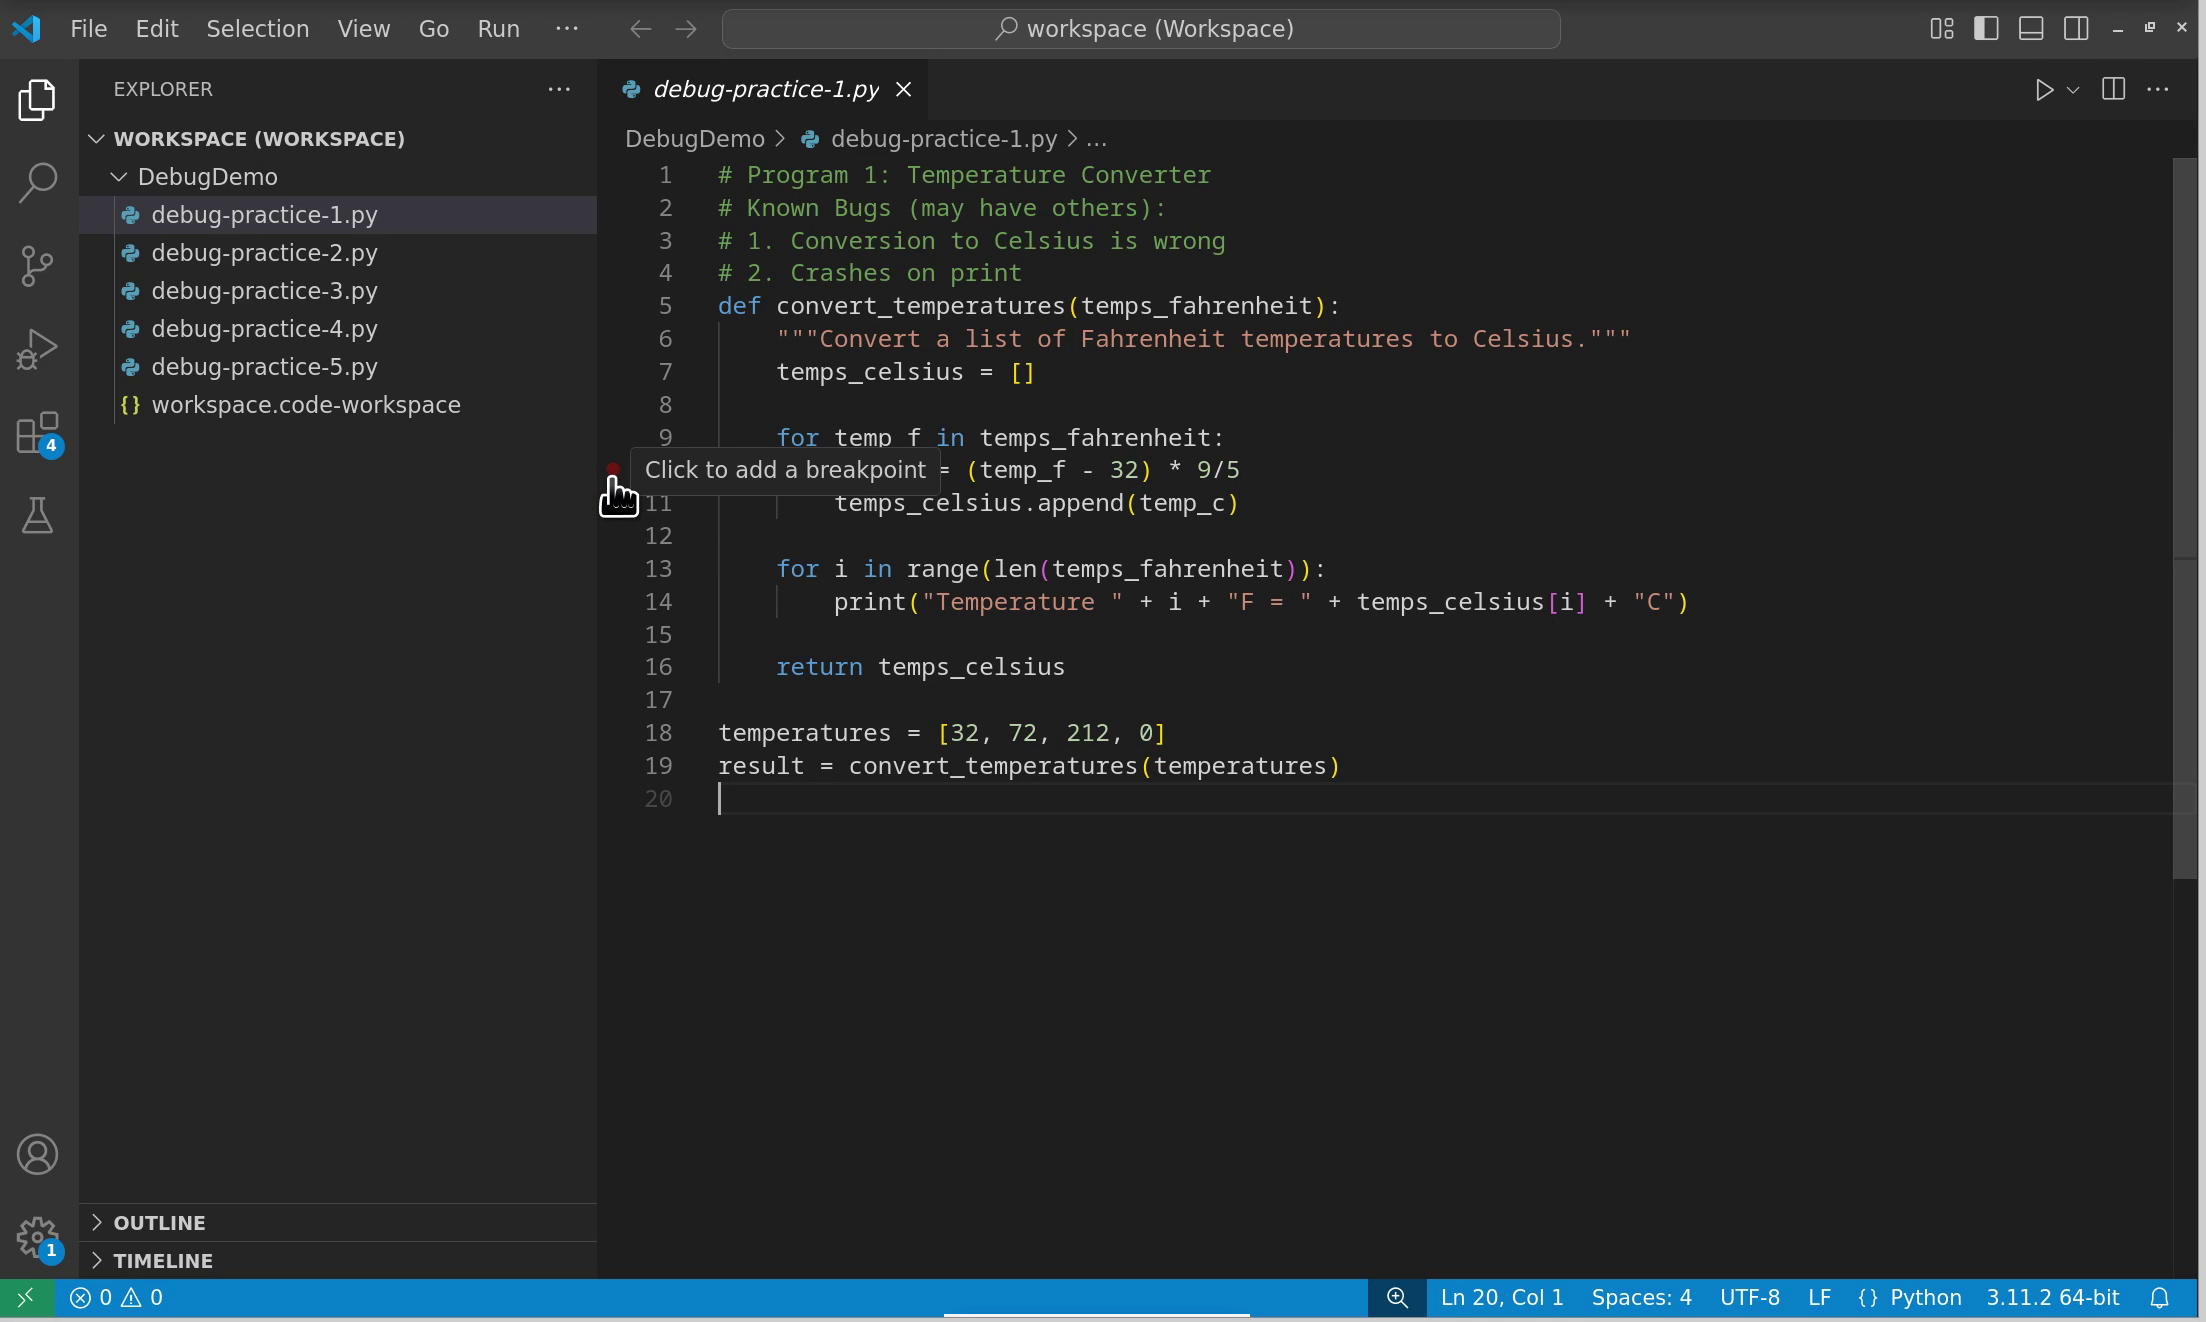
Fig. 10.1 Hovering over the line number area shows where breakpoints can be placed.#
Click on this area to set a breakpoint. A solid red dot will appear, indicating that you have successfully added a breakpoint. To remove a breakpoint, simply click on the red dot and it will disappear.
10.3.4.2. Starting the debugger#
To initiate debugging in VS Code, you have several options. Click on the down arrow next to the run button and select “Python Debugger: Debug Python File”.
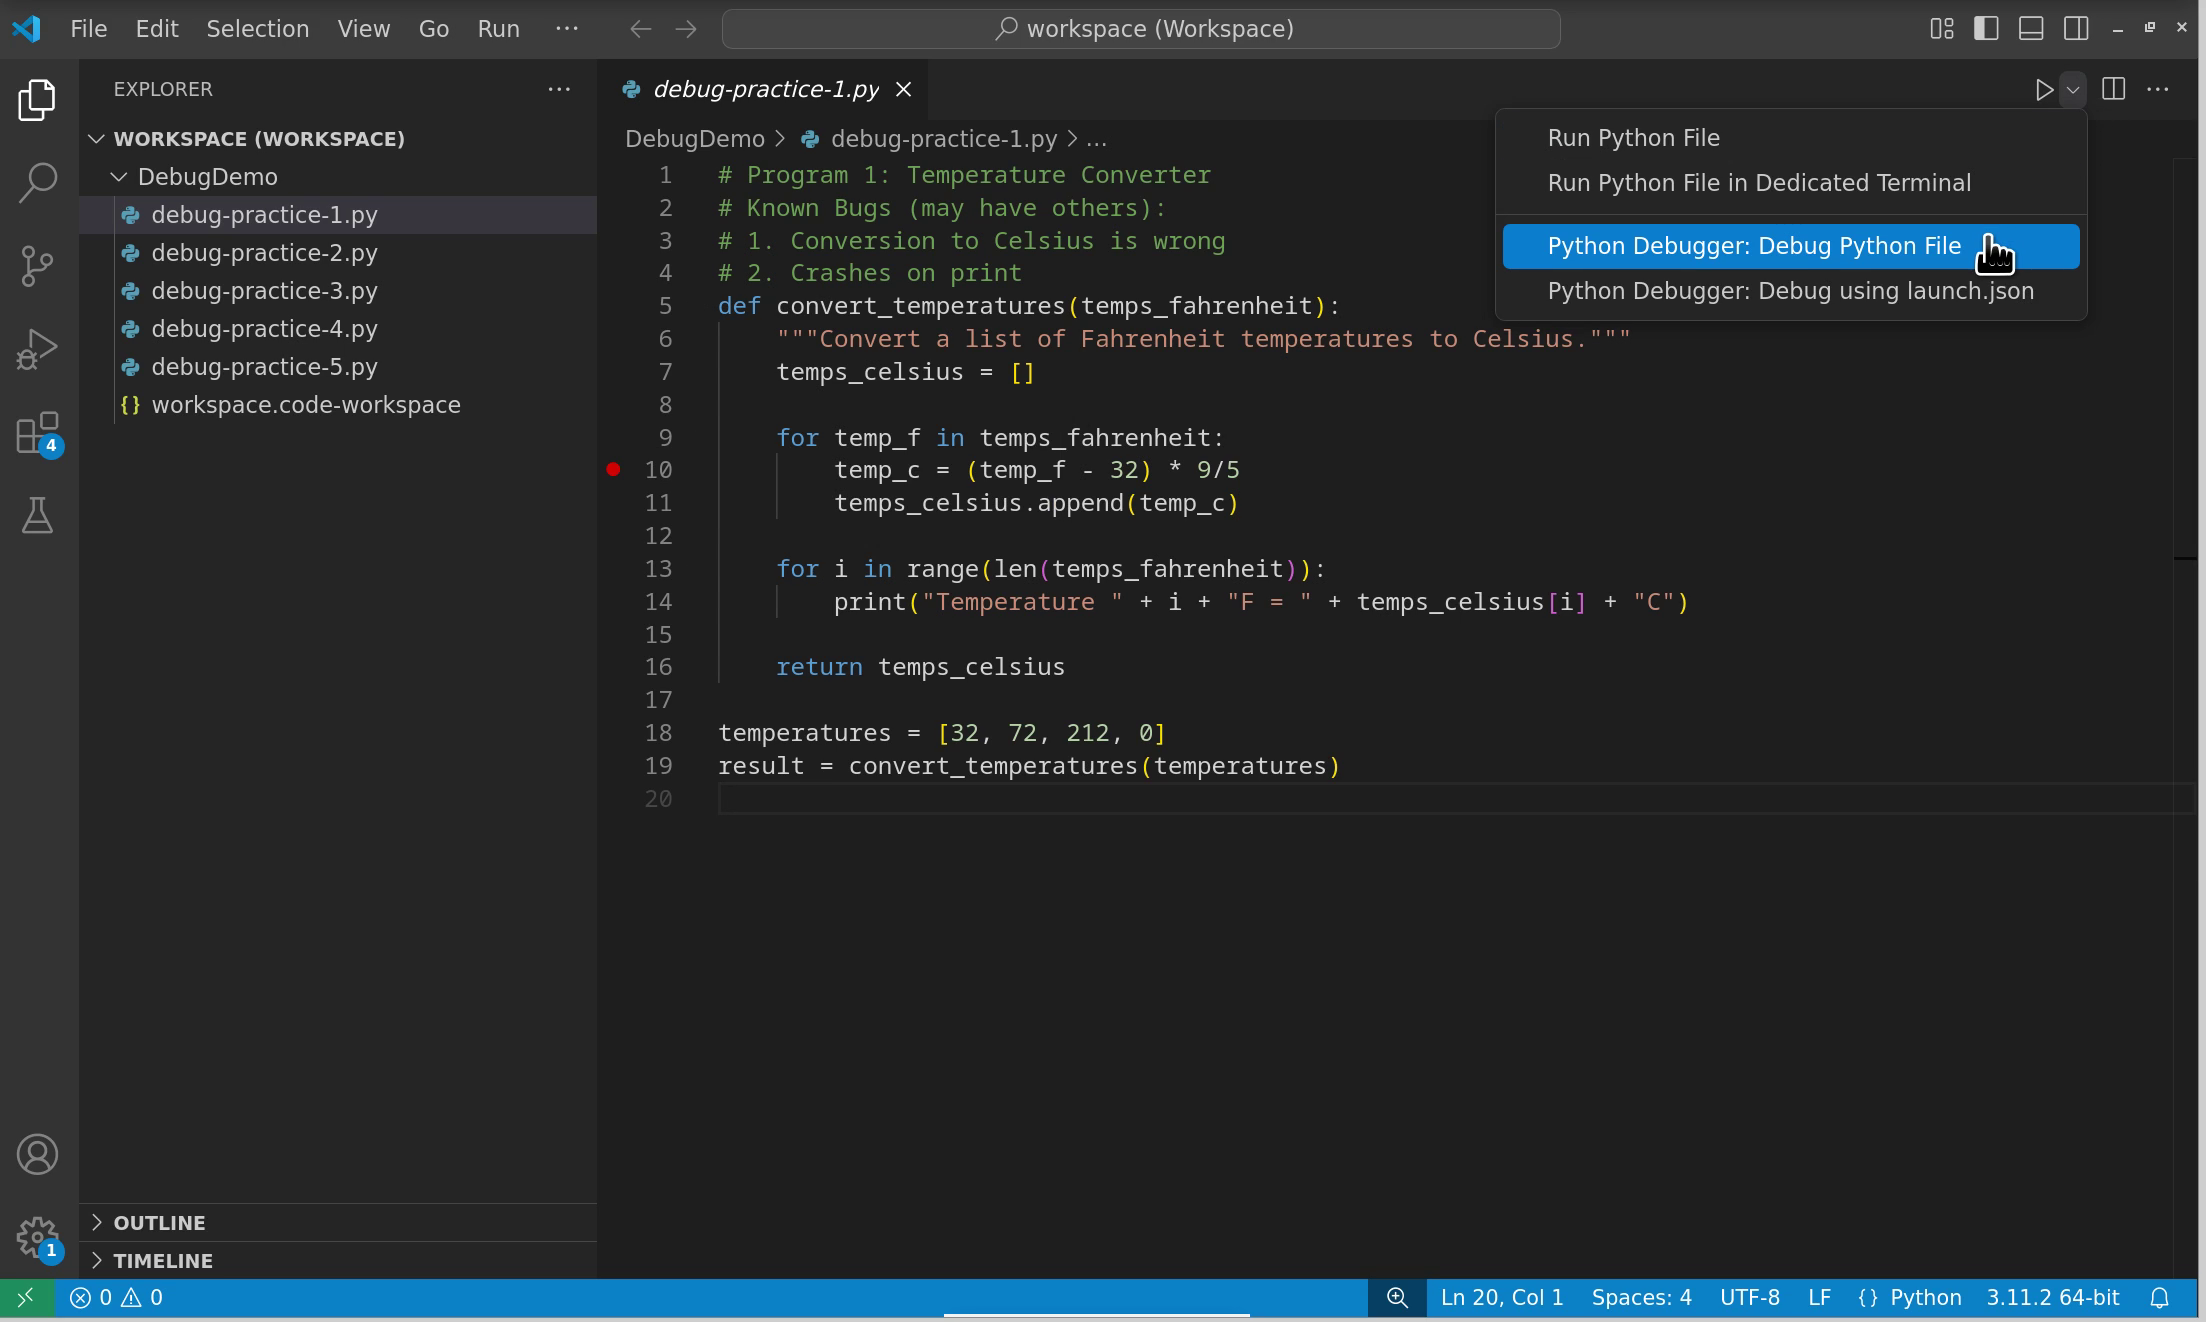
Fig. 10.2 Selecting Python Debugger from the run dropdown menu.#
Alternatively, you can:
Click Run and Debug in the activity bar on the left side
Press
F5to start debugging the current fileUse the Command Palette (
Ctrl+Shift+PorCmd+Shift+P) and search for “Debug”
Once debugging has initiated, you will see the debug interface:
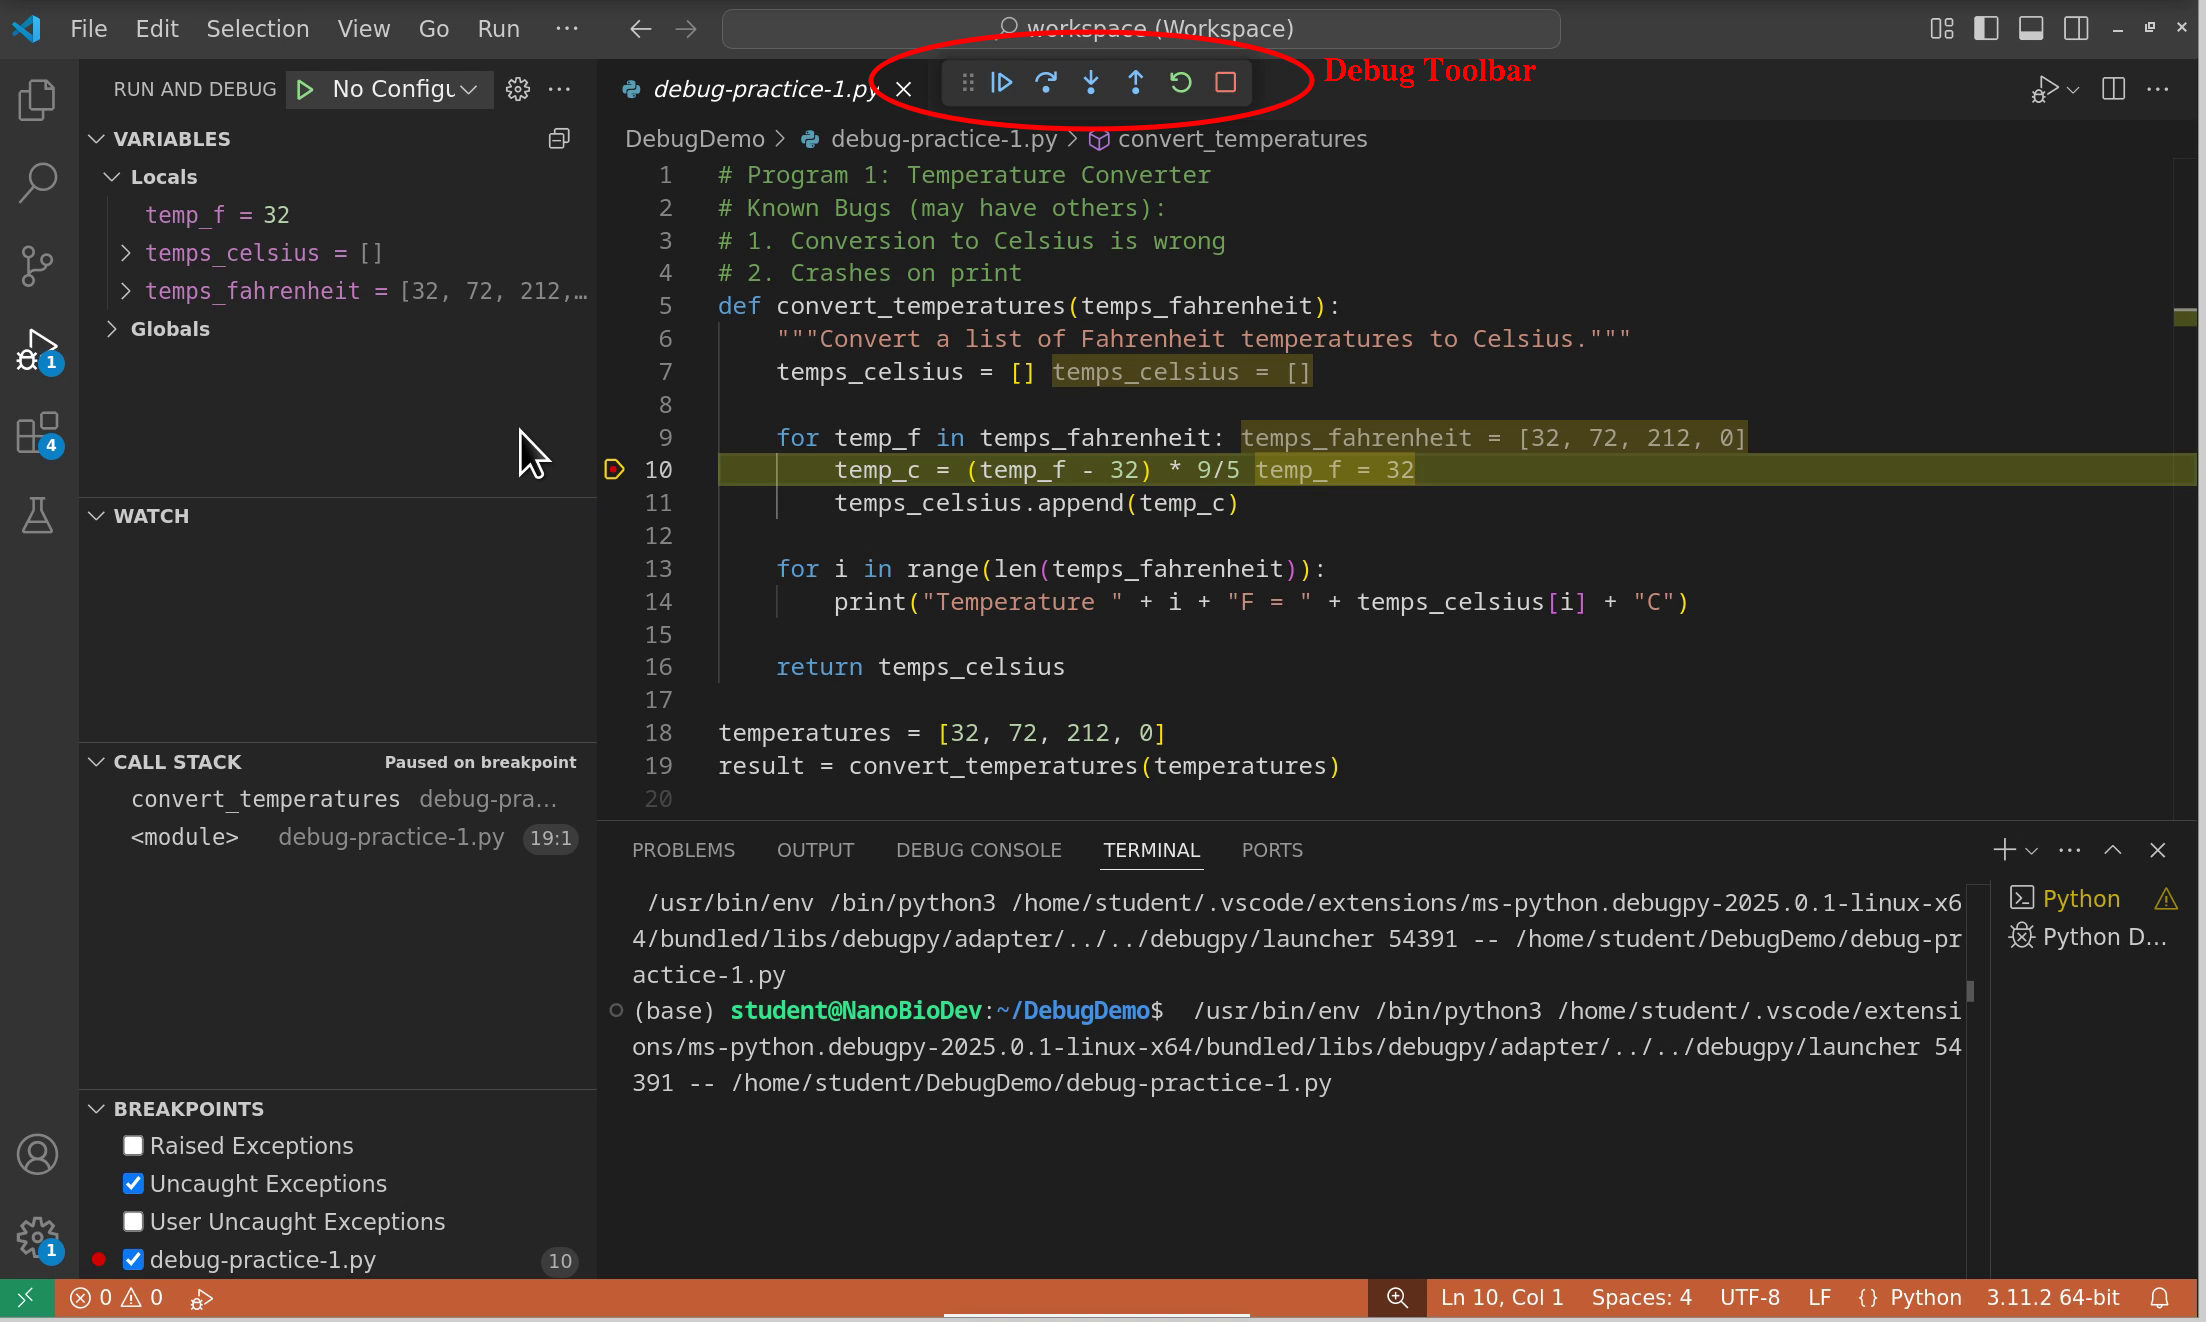
Fig. 10.3 VS Code debug interface showing variables, call stack, watches, and debug controls.#
10.3.4.3. Understanding the debug interface#
When debugging begins, several important panels appear:
Variables Panel (left side):
Locals: Shows variables in the current function scope
Globals: Shows module-level variables
Variables are updated in real-time as you step through code
Recently changed values are highlighted
Debug Toolbar (top):
Continue (
F5): Resume execution until the next breakpointStep Over (
F10): Execute the current line and move to the nextStep Into (
F11): Enter into function callsStep Out (
Shift+F11): Complete the current function and returnRestart (
Ctrl+Shift+F5): Start debugging from the beginningStop (
Shift+F5): End the debugging session
Additional Panels:
Call Stack: Shows the execution path and allows navigation between function contexts
Watch: Monitor specific expressions throughout debugging
Breakpoints: Manage all breakpoints in your code
Important: Breakpoints stop execution before the marked line executes. This means any variables assigned on that line won’t have values yet.
10.3.5. Single stepping#
Step over. The debugger executes the current line of code and moves to the next line in the current function. If the line contains a function call, the entire function will be executed, but the debugger will not enter that function. Instead, it will move to the next line after the function call. Use this option when you want to execute the current line and continue to the next line without diving into any functions called on that line. This is useful for skipping over functions whose internal behavior you don’t need to inspect.
Step into. Allows you to go into the function that is called on the current line of code. If the current line contains a function call, the debugger will enter that function, allowing you to debug it line by line. Use this option when you want to inspect the behavior of a specific function in detail. If you suspect there might be an issue within that function, stepping into it lets you see how the code executes line by line.
Step out. Runs the remaining lines of the current function and pause at the line of code immediately following the function call in the calling function. It effectively allows you to exit the current function without stepping through every line. Use this option when you are inside a function and have seen enough of its execution.
Action |
Description |
When to use |
|---|---|---|
Step over |
Executes the current line, skipping over function calls, and moves to the next line. |
When you don’t need to inspect the function’s internal behavior. |
Step into |
Enters the function called on the current line, allowing you to debug it line by line. |
When you want to inspect a function’s behavior closely. |
Step out |
Completes the execution of the current function and returns to the caller. |
When you have finished debugging the current function and want to return to the calling code. |
10.3.5.1. Example 1: Basic debugging#
Explore single stepping options in Python’s debugger by yourself!
Copy this code in a Python script in your VS Code:
def multiply(x, y):
    return x + y

def calculate_area(length, width):
    area = multiply(length, width)
    print("Area:", area)

length = 5
width = 10
a = calculate_area(length, width)

print("This is x: ", x)
print("This is y: ", y)
print("The area is: ", a)
Look at the code. What does it do? Are there any mistakes/bugs in it? If yes, keep them in the code for now.
Place a breakpoint on line
a = calculate_area(length, width). Start debugger in VS Code. Observe variables at this point.Explore different stepping options. First, try to click Step over (you can continue clicking on it more than once). What happens? To which line in code does the debugger go? If you find a bug, feel free to correct it.
Restart your debugger. This time, try to use Step into. In which order does the debugger check your code lines?
Restart your debugger again. Use Step into, but while you’re inside the
multiplyfunction, click on Step Out. What happens in this case?
10.3.6. Exercises#
Below you will find five pieces of Python code. Each code has bugs - some are listed (known), and you may discover more bugs on top of the listed ones while debugging. Use the above-explained VS Code’s debugger to assist you with debugging each of the Python programs below.
Exercise 10.5 (Temperature converter)
# Program 1: Temperature Converter
# Known Bugs (may have others):
# 1. Conversion to Celsius is wrong
# 2. Crashes on print

def convert_temperatures(temps_fahrenheit):
    """Convert a list of Fahrenheit temperatures to Celsius."""
    temps_celsius = []

    for temp_f in temps_fahrenheit:
        temp_c = (temp_f - 32) * 9/5
        temps_celsius.append(temp_c)

    for i in range(len(temps_fahrenheit)):
        print("Temperature " + i + "F = " + temps_celsius[i] + "C")

    return temps_celsius

temperatures = [32, 72, 212, 0]
result = convert_temperatures(temperatures)
Exercise 10.6 (Word counter)
# Program 2: Word Counter
# Known Bugs (may have others):
# 1. Word count is wrong

def count_words(sentence):
    """Count the number of words in a sentence."""
    if sentence == "":
        return 1

    words = sentence.split()
    word_count = len(words) + 1

    return word_count

test_sentences = [
    "Hello world",
    "",
    "Python programming is fun",
    "One"
]

for sentence in test_sentences:
    print(f"Word count: {count_words(sentence)}")
Exercise 10.7 (Number series generator)
# Program 3: Number Series Generator
# Known Bugs (may have others):
# 1. Doesn't generate the whole series
# 2. Sum of squares is wrong
# 3. Step size is always one

def generate_series(start, end, step):
    """Generate a series of numbers and their squares."""
    numbers = []
    squares = []

    for i in range(start, end):
        numbers.append(i)
        squares.append(i ** 2)

    sum_squares = 1
    for square in squares:
        sum_squares += square

    return numbers, squares, sum_squares

result = generate_series(1, 5, 1)
print("Numbers:", result[0])
print("Squares:", result[1])
print("Sum of squares:", result[2])
Exercise 10.8 (List reverser)
# Program 4: List Reverser
# Known Bugs (may have others):
# 1. Printed result is always "None"
# 2. Reversed list is wrong

def reverse_list(input_list):
    """Reverse a list and remove duplicates."""
    reversed_list = input_list[0::-1]

    unique_items = []
    for item in reversed_list:
        if item not in unique_items:
            unique_items.append(item)

test_list = [1, 2, 2, 3, 4, 4, 5]
result = reverse_list(test_list)
print("Reversed and unique:", result)
Exercise 10.9 (String analyzer)
# Program 5: String Analyzer
# Known Bugs (may have others):
# 1. Vowel count is wrong
# 2. Average word length is wrong

def analyze_string(text):
    """Analyze a string for vowels and word lengths."""
    vowels = ['a', 'e', 'i', 'o', 'u']
    vowel_count = 0
    words = text.split()

    for char in text:
        if char in vowels:
            vowel_count += 1

    total_length = 0
    for word in words:
        total_length += 1

    avg_word_length = total_length / len(words)

    return {
        'vowels': vowel_count,
        'average_word_length': avg_word_length
    }

sample_text = "Python Programming Is Fun"
result = analyze_string(sample_text)
print("Analysis:", result)
10.3.7. (Optional reading)#
10.3.7.1. Advanced breakpoint features#
Standard breakpoints stop execution every time they’re reached, but VS Code offers more sophisticated options for complex debugging scenarios.
10.3.7.1.1. Conditional breakpoints#
When debugging loops or frequently-called functions, you might want to stop only under specific conditions. Right-click on a breakpoint (or set a new one with a right-click) and select “Edit Breakpoint” to add conditions.
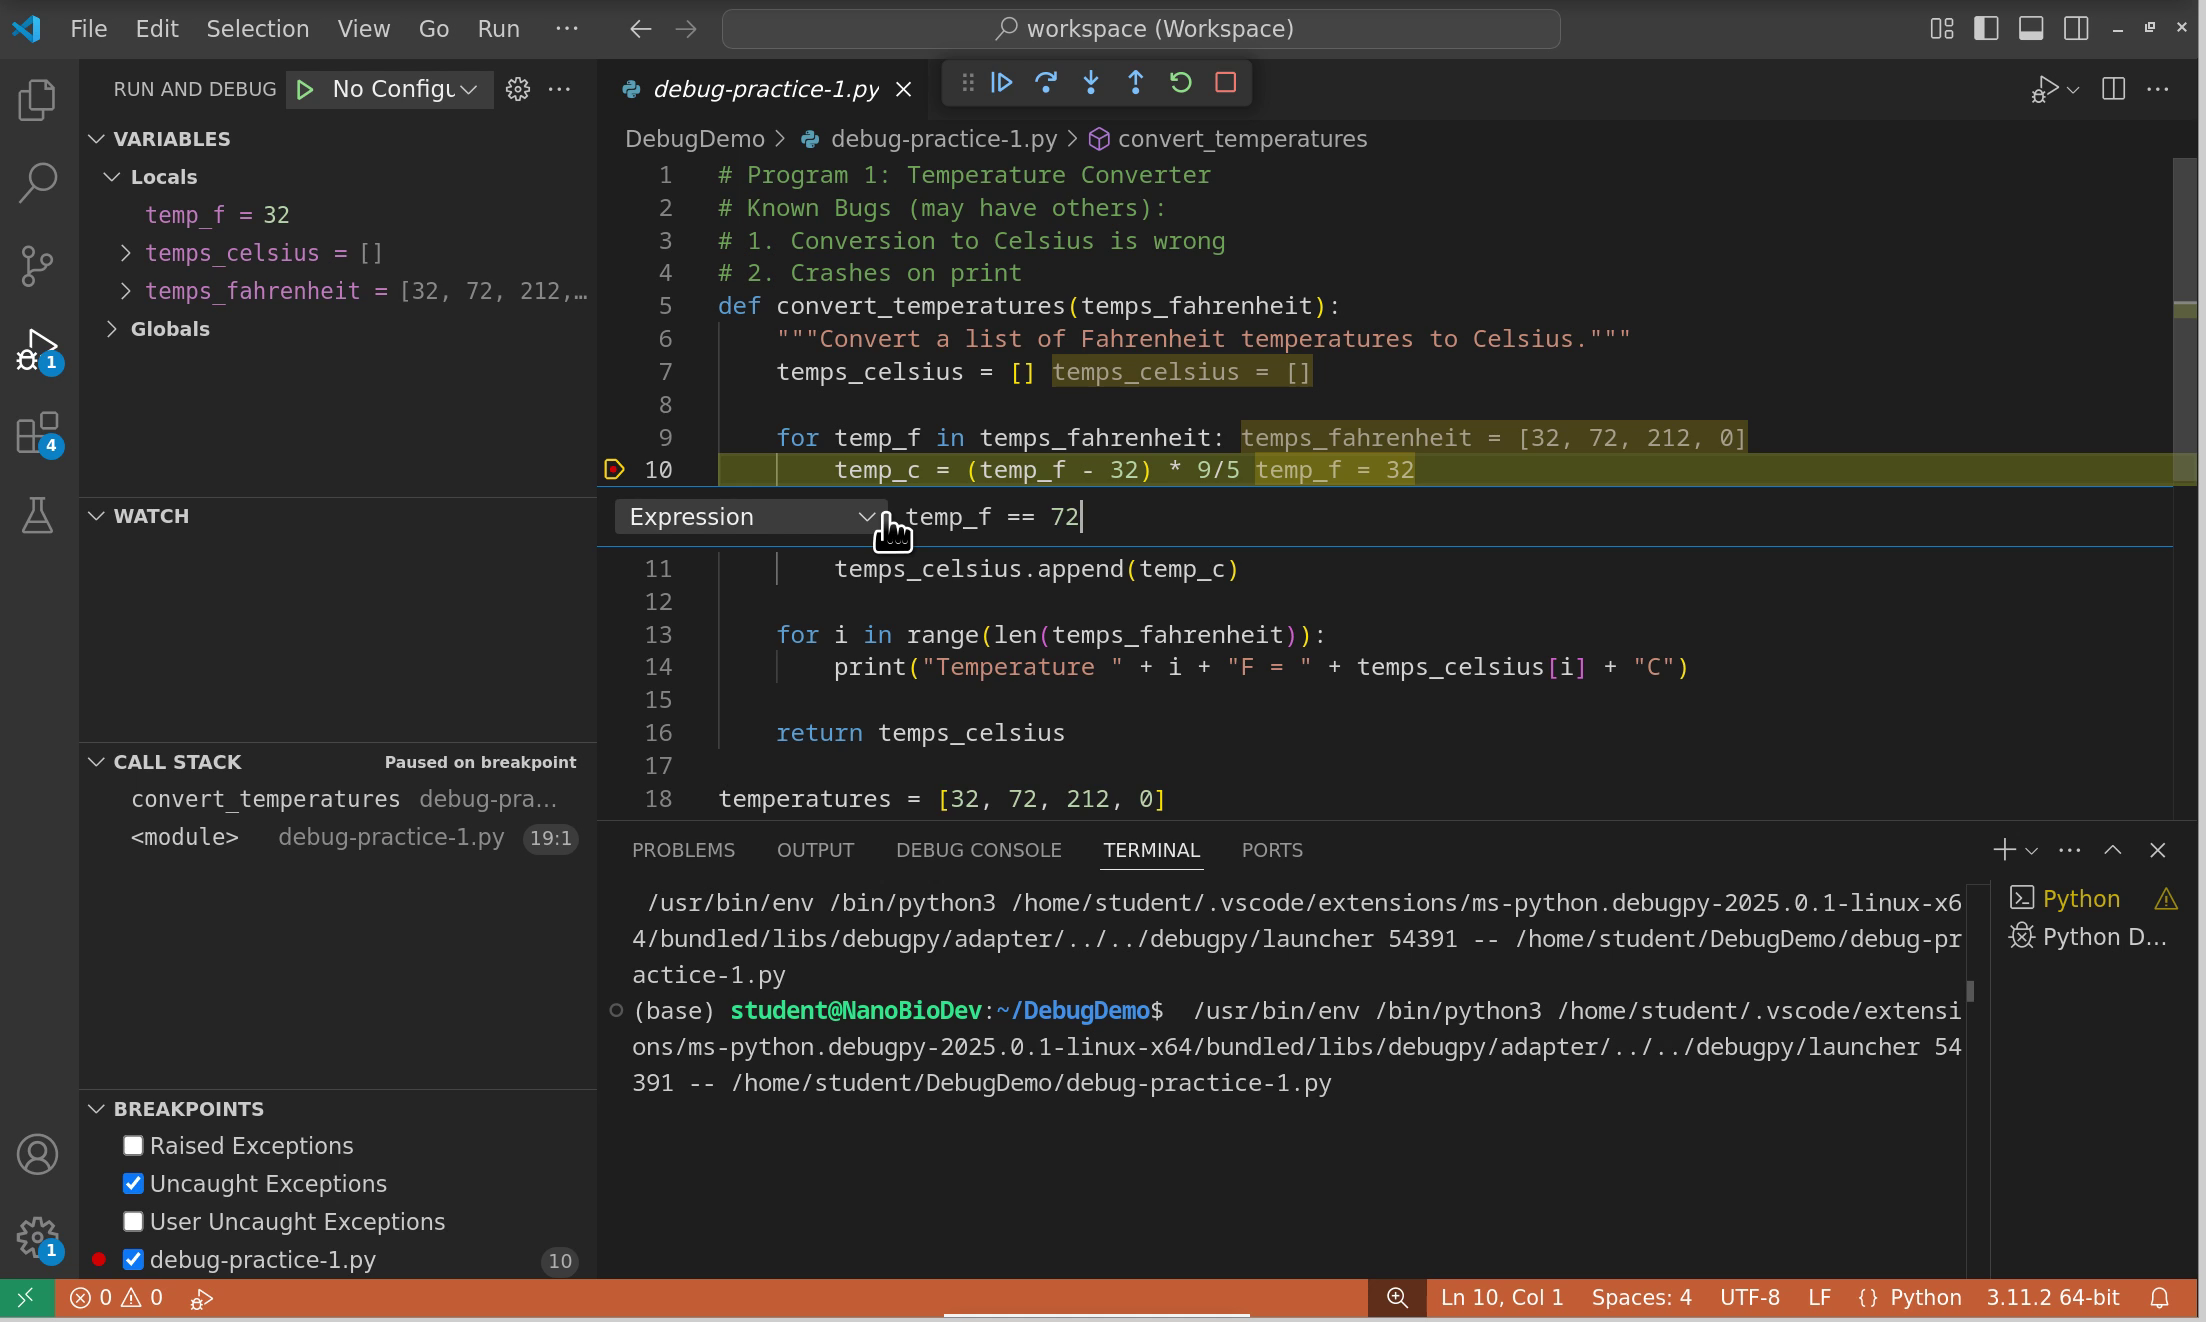
Fig. 10.4 Setting a conditional breakpoint that only triggers when temp_f equals 72.#
Expression conditions: Stop only when an expression evaluates to True
Example:
temp_f == 72- stops when the temperature equals 72Example:
len(data) > 100- stops when data exceeds 100 itemsExample:
error_count > 0- stops when errors are detected
Hit count conditions: Stop after the breakpoint has been hit a certain number of times
Useful when you know a bug occurs on the nth iteration
Example: Stop on the tenth time through a loop
10.3.7.1.2. Logpoints#
Sometimes you want to track values without stopping execution. Logpoints (set by right-clicking and selecting “Add Logpoint”) print messages to the debug console without pausing:
Use curly braces for variables:
Temperature is {temp_f}°FNo need to modify your code with print statements
Messages appear in the Debug Console panel
10.3.7.2. Using the debug console#
The Debug Console is a powerful feature that allows you to interact with your program while it’s paused at a breakpoint. You can execute Python code in the current context, which is invaluable for testing fixes and exploring program state.
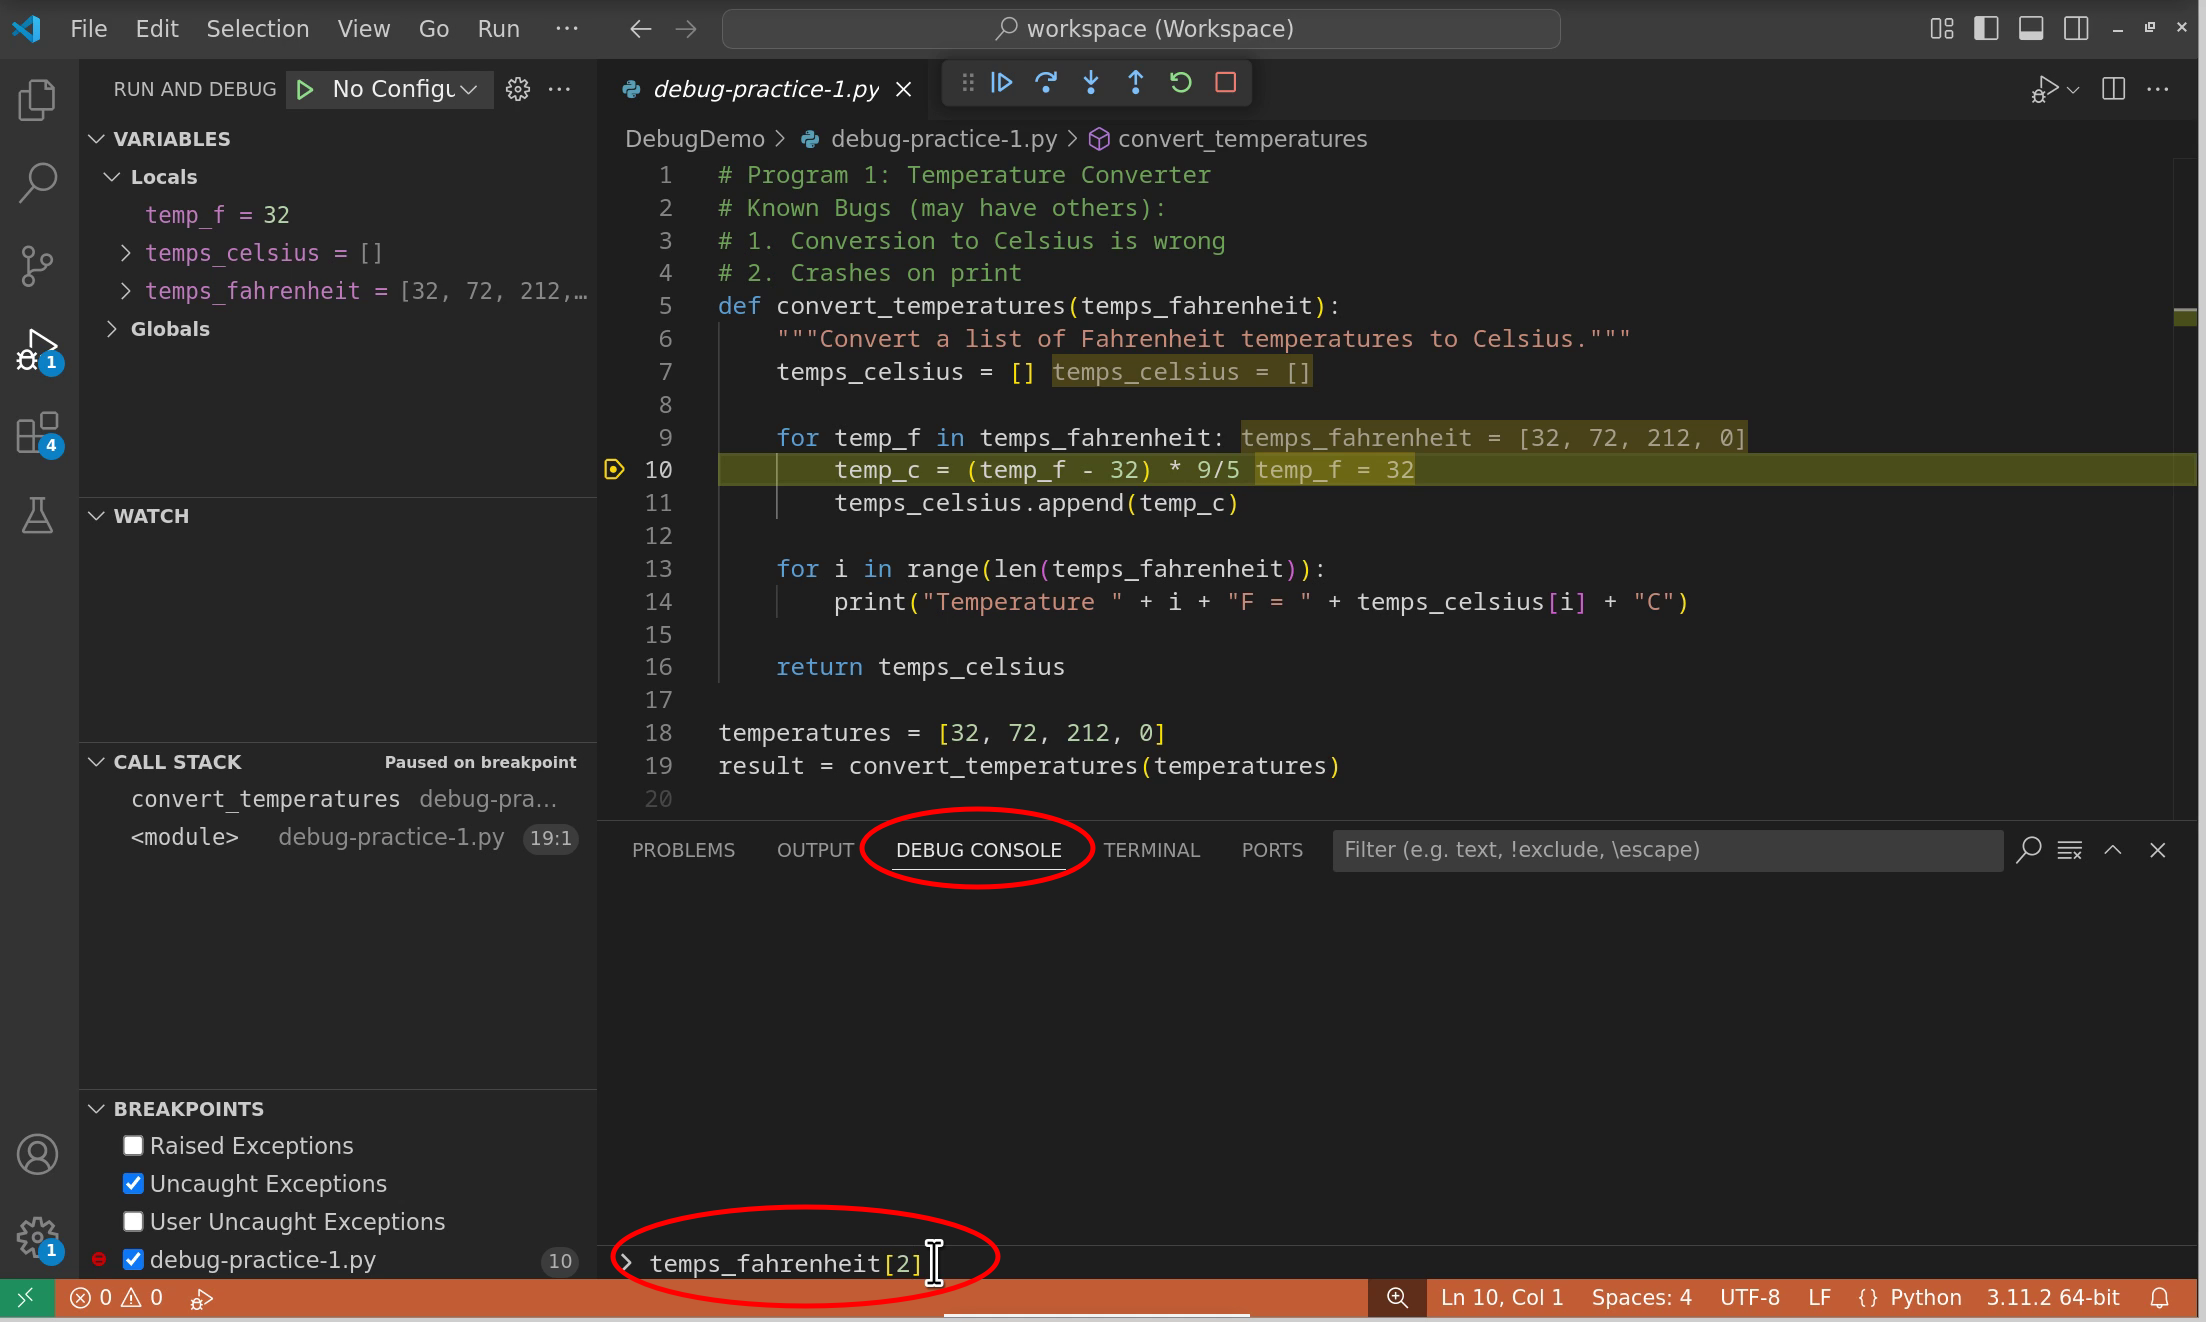
Fig. 10.5 Using the debug console to evaluate expressions and test code fixes.#
What you can do in the debug console:
Evaluate expressions: Type any Python expression to see its value
temp_c  # View the current value
temp_f * 2  # Perform calculations
len(temps_celsius)  # Check list length
Test potential fixes: Before modifying your code, test solutions
# Test if your fix will work
(temp_f - 32) * 5/9  # Correct formula
str(temp_c) + "°C"  # Test string formatting
Modify variables: Change values to test different scenarios
temp_f = 100  # Temporarily change value
temps_celsius.append(0)  # Modify lists
Tip
Changes made in the debug console are temporary and only affect the current debugging session. They don’t modify your source code.
10.3.7.3. Navigating the call stack#
The call stack shows you how your program reached its current location through function calls. This is essential for understanding program flow and debugging functions that are called from multiple places.
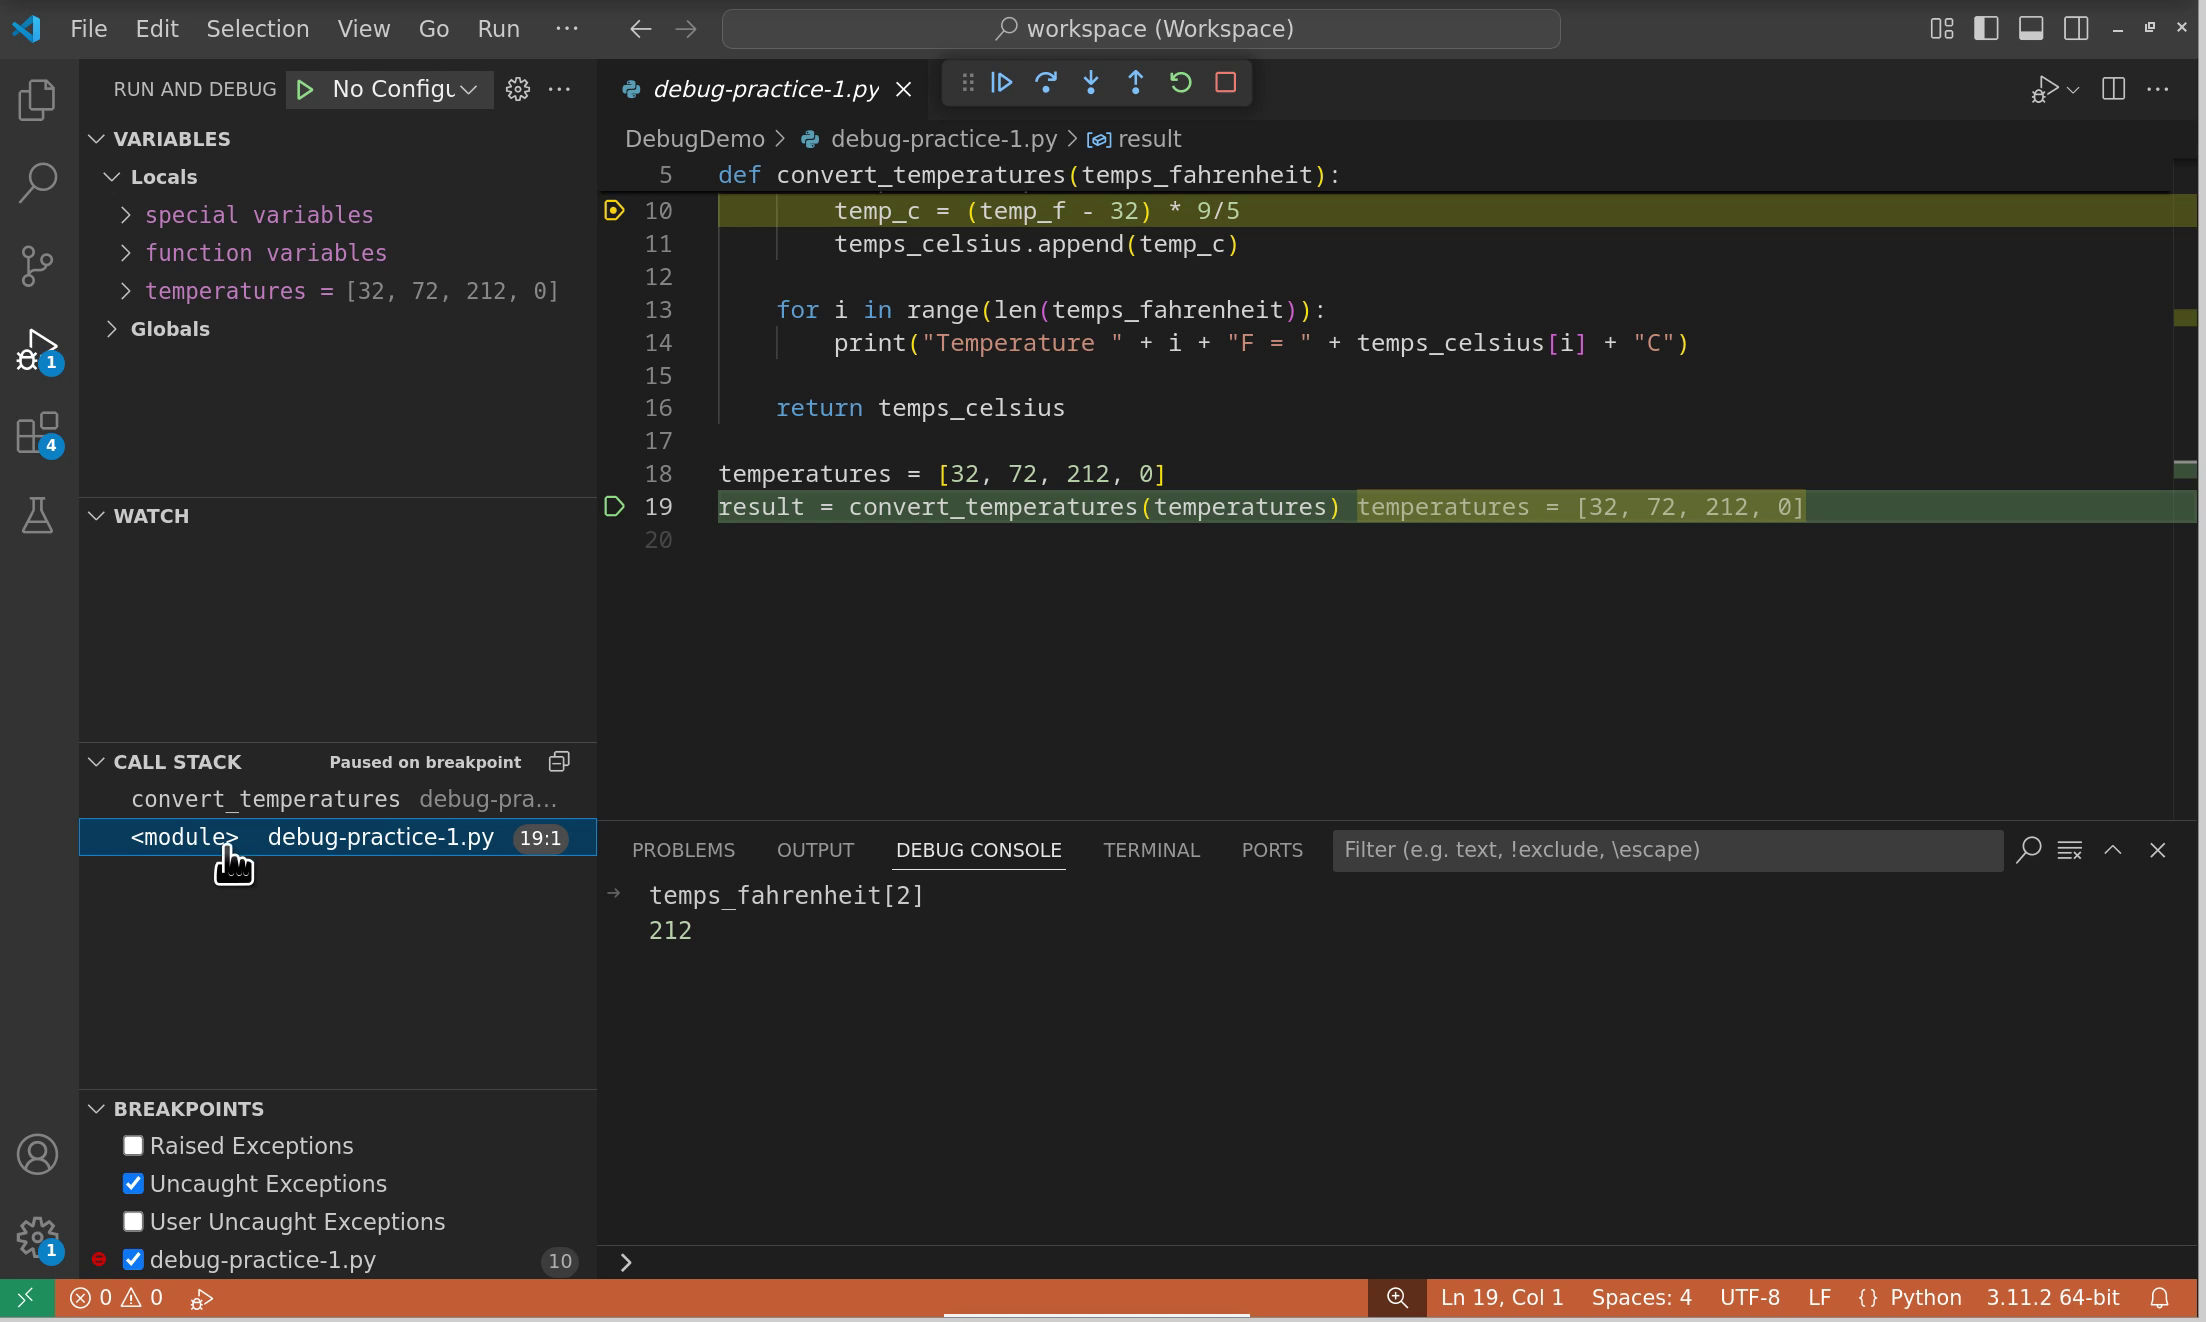
Fig. 10.6 The call stack panel showing function call hierarchy and allowing context navigation.#
Understanding the call stack:
Top of stack: The current function where execution is paused
Lower entries: Functions that called the current function
Module level: The bottom entry, representing the main program
Using the call stack effectively:
Click on any stack frame to view variables in that context
Identify parameter values passed to functions
Trace back to find where incorrect values originated
Debug recursive functions by examining different recursion levels
Example scenario: If a function receives incorrect parameters, use the call stack to:
Switch to the calling function’s context
Examine the variables before they were passed
Identify where the incorrect value originated
10.3.7.4. Watch expressions#
Watch expressions allow you to monitor specific values or calculations throughout your debugging session. They’re updated automatically whenever you pause execution.
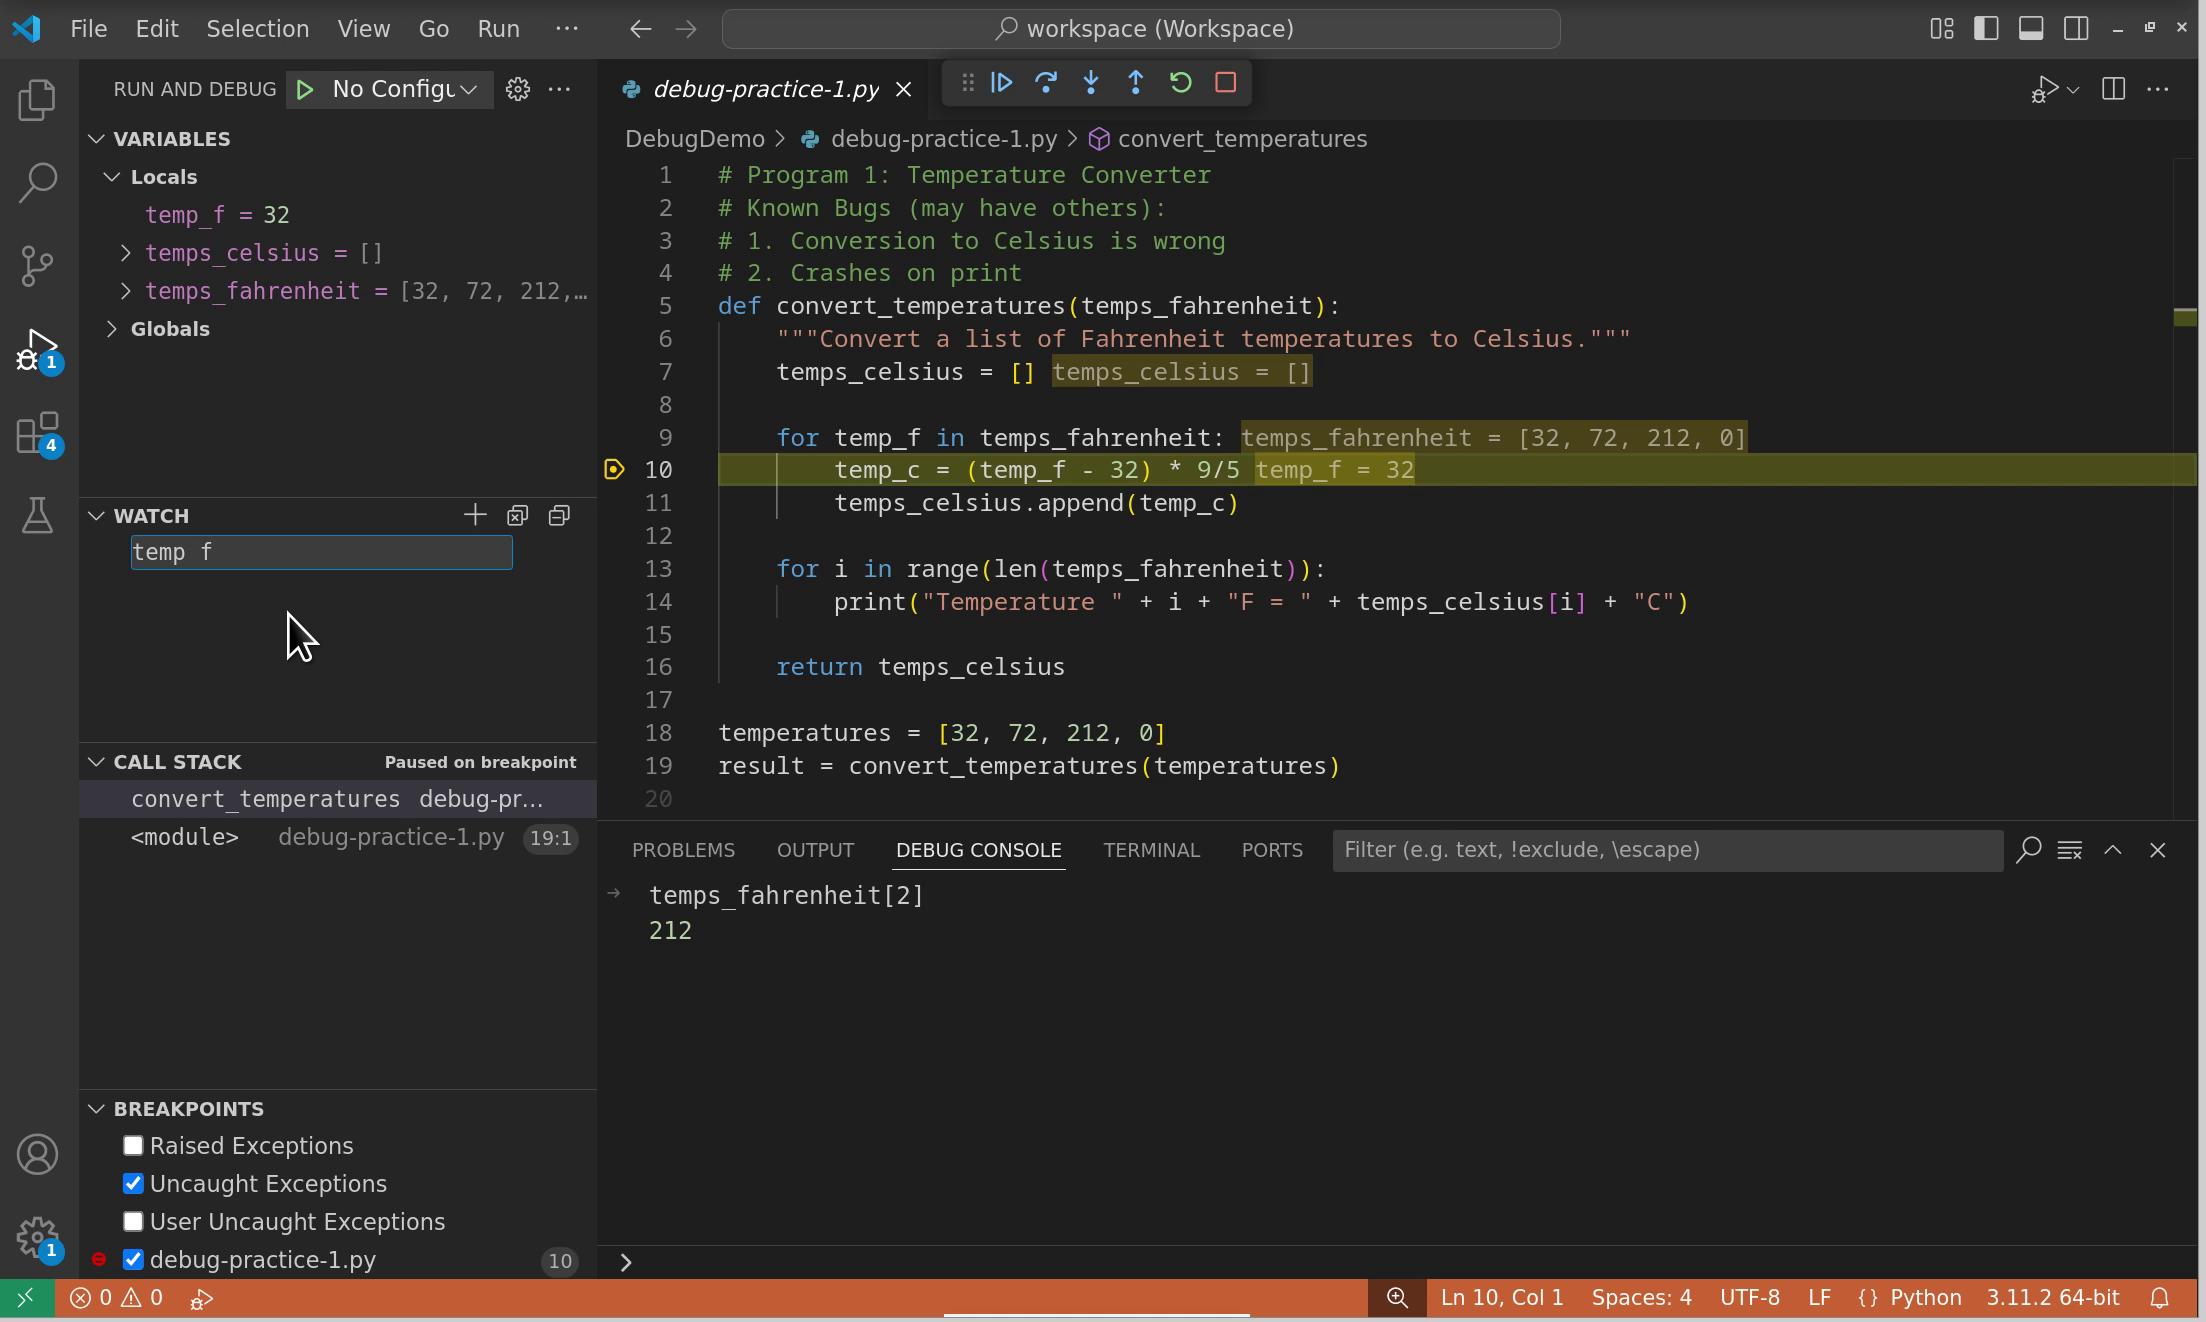
Fig. 10.7 Setting watch expressions to monitor calculated values during debugging.#
Setting up watches:
Click the + button in the Watch panel
Enter any valid Python expression
The expression is evaluated in the current context at each pause
Useful watch expressions:
Variable tracking:
len(my_list),sum(values)Condition monitoring:
x > threshold,error_count == 0Complex calculations:
(temp_f - 32) * 5/9Object properties:
my_object.status,config['debug_mode']
Pro tip: Watches are especially valuable when debugging loops. Set watches for loop counters, accumulator variables, or any values that change with each iteration.
10.3.7.4.1. Example 2: Advanced debugging features#
Practice using advanced debugging features:
Create a new Python file with this code:
def process_temperatures(temps):
    results = []
    for i, temp in enumerate(temps):
        celsius = (temp - 32) * 5/9
        results.append(f"Reading {i}: {temp}°F = {celsius:.1f}°C")
    return results

temperatures = [32, 72, 100, 212, -40, 98.6, 0]
converted = process_temperatures(temperatures)
for line in converted:
    print(line)
Conditional breakpoint: Set a breakpoint inside the loop with the condition
temp > 100. Run the debugger and verify it only stops for temperatures above 100°F.Watch expressions: Add these watch expressions:
celsiustemp > 100len(results)
Debug console: When stopped at your breakpoint, use the debug console to:
Calculate what 150°F would be in Celsius
Check the current length of the results list
Temporarily modify the
tempvariable and see how it affects the calculation
10.3.7.5. Divide and conquer debugging#
When facing a bug in a large codebase or when you’re unsure where the problem lies, the divide and conquer technique is one of the most powerful debugging strategies available.
10.3.7.5.1. The binary search approach#
This technique uses the same principle as binary search algorithms:
Identify the region where the bug might exist
Place a breakpoint in the middle of that region
Run the program and check if the bug has occurred by that point
Narrow the search:
If the bug occurred before the breakpoint: focus on the first half
If the bug occurred after the breakpoint: focus on the second half
Repeat until you’ve isolated the exact location
10.3.7.5.2. Practical example#
Imagine you have a function that processes data through multiple steps, and the output is incorrect:
def process_data(data):
    # Step 1: Clean data
    cleaned = clean_data(data)

    # Step 2: Transform data
    transformed = transform_data(cleaned)

    # Step 3: Calculate statistics
    stats = calculate_stats(transformed)

    # Step 4: Format output
    result = format_output(stats)

    return result
Using divide and conquer:
Set a breakpoint after
transform_data()Check if
transformedcontains correct valuesIf yes, the bug is in steps 3 or 4; if no, it’s in steps 1 or 2
Continue narrowing until you find the problematic step
10.3.7.5.3. When to use this technique#
Large codebases: When you have hundreds or thousands of lines to search
Unfamiliar code: When debugging code you didn’t write
Intermittent bugs: When combined with conditional breakpoints
Performance issues: To identify which section causes slowdowns
Key requirement: You must be able to determine whether the bug has occurred at each checkpoint, either by examining variables or observing program behavior.
10.3.7.5.4. Example 3: Divide and conquer#
Apply the divide and conquer technique to find a bug:
def analyze_data(numbers):
    # Step 1: Remove negatives
    positive = [n for n in numbers if n >= 0]

    # Step 2: Square each number
    squared = [n ** 2 for n in positive]

    # Step 3: Filter out values over 100
    filtered = [n for n in squared if n < 100]

    # Step 4: Calculate average
    if filtered:
        average = sum(filtered) / len(filtered)
    else:
        average = 0

    # Step 5: Format result
    result = f"Average: {average:.2f}"

     return result

# Test data - should give "Average: 30.00"
# (positive: [5, 10, 3], squared: [25, 100, 9], filtered: [25, 9], average: 17)
test_data = [5, -2, 10, 3, -8]
print(analyze_data(test_data))
The expected output is wrong in the comment. Use divide and conquer to:
Find which step produces unexpected results
Identify why the filtering isn’t working as described
Fix the bug to match the expected behavior