
4. Enzyme Regulation#
As we learned in Chapter 3, enzymes catalyze reactions and generate product orders of magnitude faster than uncatalyzed reactions. Enzyme catalysis enables cellular life – without catalysis, the series of reactions that convert nutrients to living biomass (i.e., cell growth) would be impossible. However, cell growth is more than fast enzymatic reactions. Enzyme activity must also be controlled to ensure that the products generated are produced in a balanced manner. To return to our example of bacteria growing in minimal defined medium: simple nutrients (glucose, phosphate, and ammonia) must be converted to 20 different amino acids for proteins, 4 different nucleotides for DNA and RNA, lipids for membranes, and sugars for structural polysaccharides. If enzymes for the fatty acid synthesis pathway generate fatty acids in an unregulated manner, the pools of metabolites used as precursors for all these building blocks would be diverted into fats and the cell may not produce sufficient amino acids.
This illustrates one of the challenges faced by living organisms: the orchestration of various metabolic functions (and the enzymatic reactions that drive them) in a way that is responsive to the immediate needs of the cell. These needs change depending upon nutrient availability, developmental requirements, environmental stress, and resource competition with other organisms in the environment. One way that cells control metabolic pathways is that each pathway is used only to make just the right amount of product that the needs and not more. As such, it makes evolutionary sense to inhibit enzymes when sufficient product is generated and the reactions that make the product are therefore no longer needed. This chapter describes enzyme inhibition, its structural basis, and how it is used to orchestrate metabolic pathways.
4.1. Enzyme efficiency#
The Michaelis-Menten equation below describes reaction rate \(V_0\) as a function of substrate concentration \([S]\) for a single-substrate enzyme:
We have seen (Chapter 3) how, in nature, most enzymes are not designed to maximize \(k_\text{cat}\) (or \(k_2\) for single-substrate reactions). While some enzymes such as superoxide dismuatase and carbonic anhydrase feature extremely high \(k_\text{cat}\) values, for the “average” enzyme \(k_\text{cat}\) is about 10/sec. Since the rates of \(ES\) formation from \(E\) and \(S\) and \(ES\) dissociation back into free \(E\) and \(S\) are usually very fast relative to \(k_\text{cat}\), this means that most \(ES\) complexes will dissociate before catalysis occurs. This seems inefficient, and indeed, for enzymes with biotechnological applications, it is also inconvenient. Thus, enzyme engineering is a very active area of research routinely used by companies to modify enzymes.
The word “efficiency” is not often well-defined, so let’s define it here: the likelihood of an \(ES\) complex generating product \(P\) instead of dissociating back to \(E+S\). To flesh this out further, imagine a perfectly-efficient enzyme-substrate pair in which nearly every substrate binding event produces product (so nearly all \(ES\) complexes generate P instead of dissociating back into \(E+S\)). What would this ideally-efficient enzyme mean in terms of the Michaelis-Menten kinetic scheme?
Let’s look back at Equation (3.2) from Chapter 3:
Remember the two possible fates for the enzyme-substrate complex \(ES\): either it produces product \(P\) at a rate defined by \(k_2\), or the substrate dissociates from the enzyme active site at rate \(k_{-1}\) to regenerate free enzyme E and free substrate S. If we want every ES complex that is formed by a substrate binding event to produce product, then the rate \(k_2\) must be much larger than the rate \(k_{-1}\) – in other words, catalysis must be faster than enzyme-substrate dissociation. Note that this does not require an extremely high \(k_2\) value: only that \(k_2 >> k_{-1}\). (In terms of probability, catalysis must be much more likely to happen than substrate release.) Thus, we need a way to infer the rates \(k_{1}\), \(k_{2}\) and \(k_{-1}\) from experimental data.
So how could we design an experiment to identify enzymes with high efficiency? First, let’s identify a parameter that quantifies the efficiency of an enzyme-substrate complex. In the region of the Michaelis-Menten plot where substrate concentration is much lower that \(K_M\) (\([S] << K_M\)), the concentration of free enzyme \([E]\) will be changed negligibly by \(S\): if \([ES]\) is low, \([E]\) is \(\approx [E_T]\). This avoids the regime of enzyme saturation in which increasing \([S]\) reduces \([E]\) by causing \([ES]\) to accumulate and the effect of increasing \([S]\) on \(V_0\) yet further is attenuated. If \([S] << K_M\), we can neglect the \([S]\) term in the denominator and the Michaelis-Menten equation becomes:
Or
Now let’s expand the \(K_M\) term to show how this reflects the relative frequency of catalytic events and enzyme-substrate dissociate events:
Rearranging this slightly to highlight the key term:
Consider the term in red. This is the rate of catalysis divided by the sum of the rates of catalysis and enzyme-substrate dissociation. For a perfectly-efficient enzyme (every \(ES\) complex generates \(P\)), the term in red would be 1. The red term is a coefficient of the rate of association between \(E\) and \(S\) (\(k_{1}\)). The product of \(k_{1}\) and the red term is equivalent to the likelihood of product generation per binding event.
Thus, \(k_\text{cat}/K_M\) defines the catalytic efficiency of the \(ES\) complex. Please note the difference between catalytic efficiency and speed of the enzyme:
NEED TO KNOW
The catalytic efficiency of an enzyme, $k_\text{cat} / K_M$ refers to how many ES complexes generate product over the total amount of ES complexes formed.
The catalytic efficiency does not necessarily mean an enzyme with a rapid catalytic rate. An enzyme can be slow to make product, yet efficient in its use of substrate binding events.
But what is the fastest possible rate an enzyme can bind substrate and produce product: going from free enzyme and substrate (\(E+S\)) to product \(P\)? Relating equation (4.3) and equation (4.2) remind us that:
An enzyme is efficient if formation of the \(ES\) complex results in product formation more often than substrate release; in other words, if \(k_2 >> k_{-1}\). When this occurs, \(ES\) complex almost always makes product, and formation of the reactive enzyme-substrate complex \(ES\) from free \(S\) and free \(E\) is rate-limiting for product formation:
Therefore, if \([S] << K_M\)
which is the same as:
And if we have an extremely efficient enzyme, \(k_2 >> k_{-1}\), so the term in red approaches 1, so:
If these conditions are met, then \(k_\text{cat} / K_M = k_1\), so formation of the \(ES\) complex from \(E\) and \(S\) (\(k_{1}\)) becomes the limiting rate for product formation.
Given this measure, which enzymes are this efficient? To answer this question, we have to think about how the \(ES\) complex is formed from \(E\) and \(S\): for most enzymes, \(S\) is a small molecule that must diffuse into the active site of the enzyme. How often would this happen? Estimates obtained using the diffusion equation for how frequently a typical small molecule might encounter any part of an enzyme surface (approximated as a sphere of 2 nanometers radius) suggest that \(10^{10}\) encounters will occur per second per mole substrate. Thus for a typical in vivo substrate concentration of \(10^{-5} M\) \((10 \mu M)\), that works out to 100,000 encounters per second between an enzyme and its substrate.
As you have seen, active sites typically comprise only a small part of protein surface. Therefore, most encounters between the substrate and the enzyme will not land in the active site. Or perhaps the substrate will not be oriented properly to bind the active site. Assuming that 10% of the enzyme surface is active site, then only \(0.1 \times 10^{10} = 10^9\) encounters per second per mole substrate will touch the active site and potentially form the ES complex.
Given this estimate, any enzyme with a \(k_\text{cat} / K_M\) approaching the diffusion-limited rate of enzyme-substrate encounters must be highly efficient because most encounters between enzyme and substrate molecules result in product formation [1]. As you can see in Table 4.1, adapted from [2], some enzymes approach this level of efficiency very closely:
Enzyme |
Substrate |
\(k_\text{cat} (s^{-1})\) |
\(K_M (M)\) |
\(k_\text{cat}/K_M (M^{-1}s^{-1})\) |
|---|---|---|---|---|
Acetylcholinesterase |
Acetylcholine |
\(1.4 \times 10^4\) |
\(9 \times 10^{-5}\) |
\(1.6 \times 10^8\) |
Carbonic Anhydrase |
CO2 |
\(1 \times 10^6\) |
\(1.2 \times 10^{-2}\) |
\(8.3 \times 10^{7}\) |
Carbonic Anhydrase |
HCO3- |
\(4 \times 10^{5}\) |
\(2.6 \times 10^{-2}\) |
\(1.5 \times 10^{7}\) |
Catalase |
H2O2 |
\(4 \times 10^{7}\) |
\(1.1 \times 10^{0}\) |
\(4 \times 10^{7}\) |
Crotonase |
Crotonyl-CoA |
\(5.7 \times 10^{3}\) |
\(2 \times 10^{-5}\) |
\(2.8 \times 10^{8}\) |
Fumarase |
Fumarate |
\(8 \times 10^{2}\) |
\(5 \times 10^{-6}\) |
\(1.6 \times 10^{8}\) |
β-lactamase |
Benzylpenicillin |
\(2 \times 10^{3}\) |
\(2 \times 10^{-5}\) |
\(1 \times 10^{8}\) |
However, the vast majority of enzymes feature a \(k_\text{cat}/K_M\) value of \(\approx 10^5/M/s\). Thus, for most proteins, almost all enzyme-substrate encounters do not result in product.
This makes the highly-efficient enzymes very interesting. We can infer about enzymes with “diffusion-limited” \(k_\text{cat}/K_M\) values that they are not only highly efficient with substrate binding events (so forming product more often than releasing substrate, or \(k_2 >> k_{-1}\)), but also that encounters between the enzyme and the substrate molecules frequently create the enzyme-substrate complex. On the other hand, a low \(k_{1}\) might imply that diffusion-driven encounters between the enzyme and substrate molecules (occurring at \(10^{10}\) per second per mole substrate) usually do not result in the formation of the ES complex (1).
Note that the most efficient enzymes are not necessarily those with the highest \(k_\text{cat}\). Compare, for example, fumarase with carbonic anhydrase: the former is one order of magnitude more efficient that the latter. But the \(k_\text{cat}\) shows the opposite trend. How is that possible? Fumarase requires much less substrate to reach half maximum velocity (definition of \(K_M\)). Therefore, if both enzymes are exposed to the same concentration of their respective substrate, fewer encounters between fumarase and its substrate will be needed in order to generate product over time.
4.2. Competitive inhibition and enzyme kinetics#
Chapter 3 introduced the active site of the enzyme: the region of the folded protein where substrates bind and the enzymatic reaction occurs. As you saw, the active site is complementary in shape and electrostatic charge to increase the stability of the ES complex. Molecules that are not shaped like the substrate, or have a different electrostatic charge distribution, are highly unlikely to bind the active site. However, many molecules have similar structures. The vast majority of enzyme active sites are not perfectly selective for their substrate, which means that molecules with structures similar to the substrate may also bind the active site. As long as a non-substrate molecule occupies the active site, the intended substrate will be excluded from the active site, which means that the \(ES\) complex will not form and no product will be generated. This phenomenon in which non-substrate molecules bind enzyme active sites and thereby inhibit ES complex formation is called competitive inhibition.
Competitive inhibitors are molecules that bind an enzyme active site to form an enzyme-inhibitor complex (\(EI\)), which prevents the substrate from binding and the formation of the \(ES\) complex. If the \(ES\) complex cannot form, the reaction between the enzyme and substrate cannot take place. However, just like substrates, most competitive inhibitors will reversibly bind and dissociate from enzyme active sites. The net effect of the presence of a competitive inhibitor is to decrease the rate of product formation. This inhibition increases with higher concentration of competitive inhibitor because formation if the \(EI\) complex becomes more favorable, which decreases the concentration \([E]\) of free enzyme available for substrate binding. Under the umbrella of inhibitors, competitive inhibitors bind the enzyme in the active site; competitive inhibitors are similar enough to the substrate to fit into the active site pocket but cannot be converted into a product.
NEED TO KNOW
Inhibitors are compounds that prevent enzymatic reactions from occurring by interacting directly with the enzyme. Depending upon the mechanism of inhibition, enzymes inhibitors can be competitive, uncompetitive, mixed (competitive and uncompetitive), or allosteric.
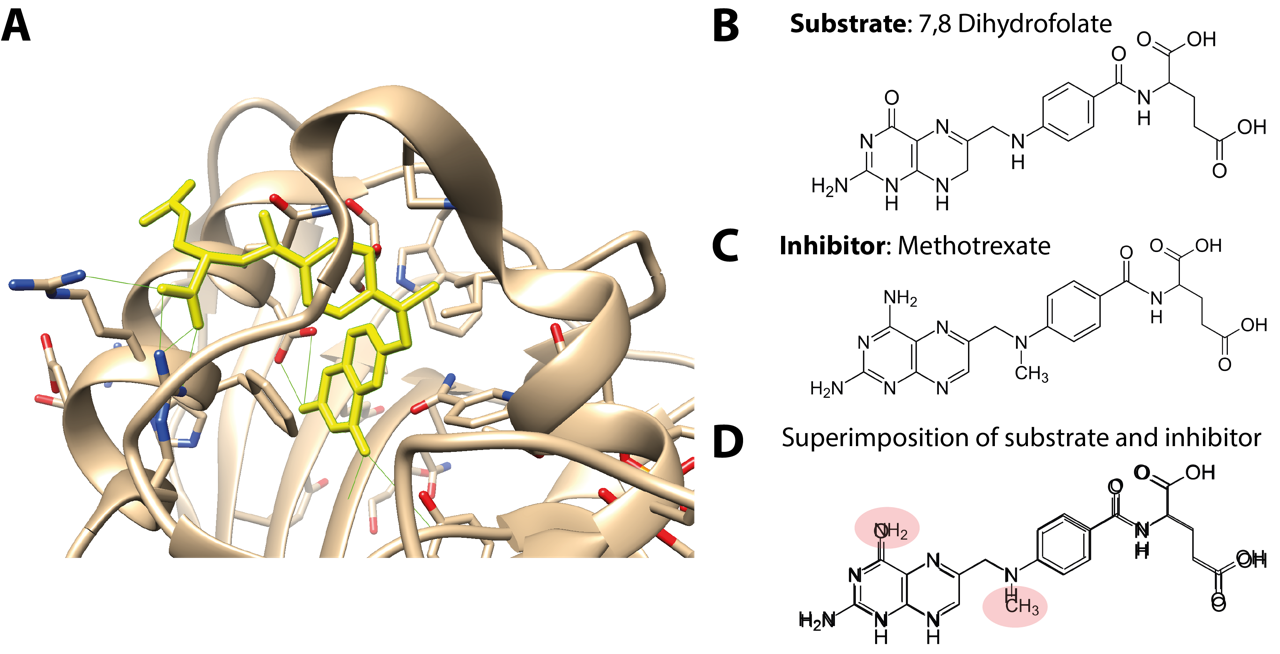
Fig. 4.1 (A) Active site of dihydrofolate reductase bound to the anti-cancer drug methotrexate (yellow), with hydrogen bonds marked in green. (B) Substrate of dihydrofolate reductase enzyme as opposed to (C) inhibitor structure. (D) Superimposition of substrate and inhibitor structures highlighting the similarity as well as the differences in chemical groups. PDB structure 1DF7 [3].#
In the presence of competitive inhibitors (denoted as \(I\)), Equation (4.2) becomes:
Upon a productive encounter, enzyme and the inhibitor will form the \(EI\) complex – the enzyme-inhibitor complex. Competitive inhibitors are so-called because the inhibitor and the substrate compete against each other for the enzyme active site. Competitive inhibition can be overcome by increasing substrate concentration \([S]\), which will increase the likelihood of a productive \(E + S\) encounter to form \(ES\), instead of an \(E + I\) encounter and formation of the \(EI\) complex. In other words, competitive inhibitors can be “outcompeted” by the substrate simply by increasing the substrate concentration. This is not true for all inhibitors, as will be illustrated below.
Competitive inhibition can be accounted for in the Michaelis-Menten equation accounting for competitive inhibition:
where
and
is the competitive inhibition constant \(K_I\).
Note that \(K_I\) is expressed as concentration units. As should be evident from the definition of α above, inhibitors with a low \(K_I\) value require a smaller concentration to decrease reaction velocity than an inhibitor with a higher \(K_I\) value. Inhibitors with \(K_I\) in the nanomolar range (nM) are considered effective inhibitors (and potentially useful for clinical medication) because a very small dose is needed to slow the enzyme reaction.
Comparing plots of reaction velocity as a function of substrate competition reveal how competitive inhibitors decrease \(V_0\):
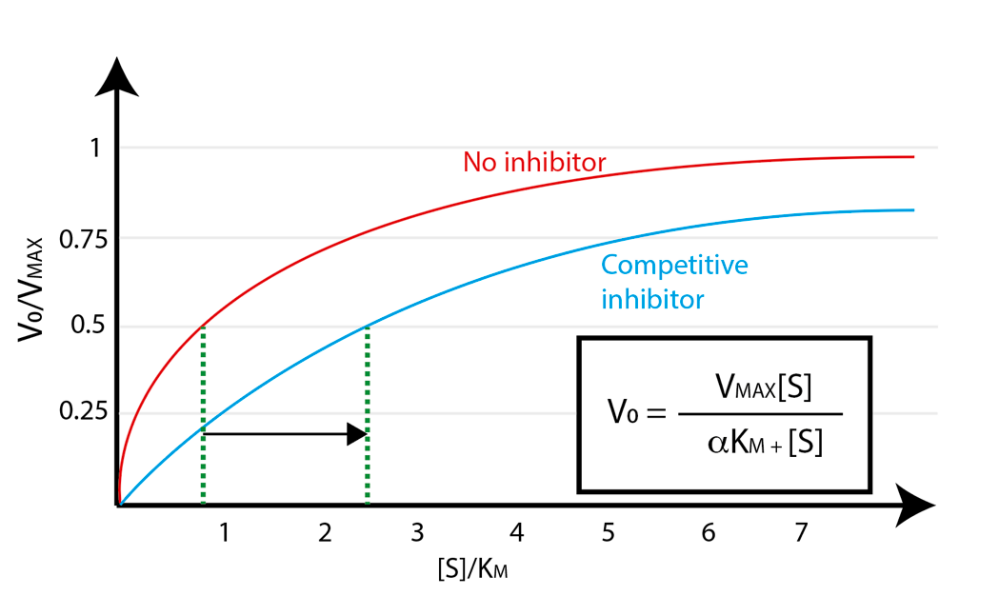
Fig. 4.2 Competitive inhibition lowers enzyme velocity \(V_0\).#
Note in Fig. 4.2 that the presence of competitive inhibitor exerts the same apparent effect on the relationship between substrate concentration and reaction velocity as increasing the Michaelis constant \(K_M\). It is still possible to approach \(V_{\text{max}}\) in the presence of a competitive inhibitor – it just requires a higher substrate concentration than would be needed in the absence of the inhibitor. Of course, competitive inhibitors do not actually increase \(K_M\), because \(K_M\) is a specific property of an enzyme-substrate pair.
4.2.1. Product inhibition#
In the cellular environment, product inhibition is a ubiquitous form of competitive inhibition. Products are often effective enzyme inhibitors because they have a similar structure to the substrate to occupy the active site blocking productive \(E+S\) encounters. This is true especially in conditions when \([P] >> [S]\):
But \(EP\), unlike \(E\), is not available to bind \(S\)!
The enzyme phosphopantetheine adenylyltransferase catalyzes transfer of AMP from ATP to 4’-phosphopantetheine, generating 3′-dephospho-CoA and pyrophosphate:
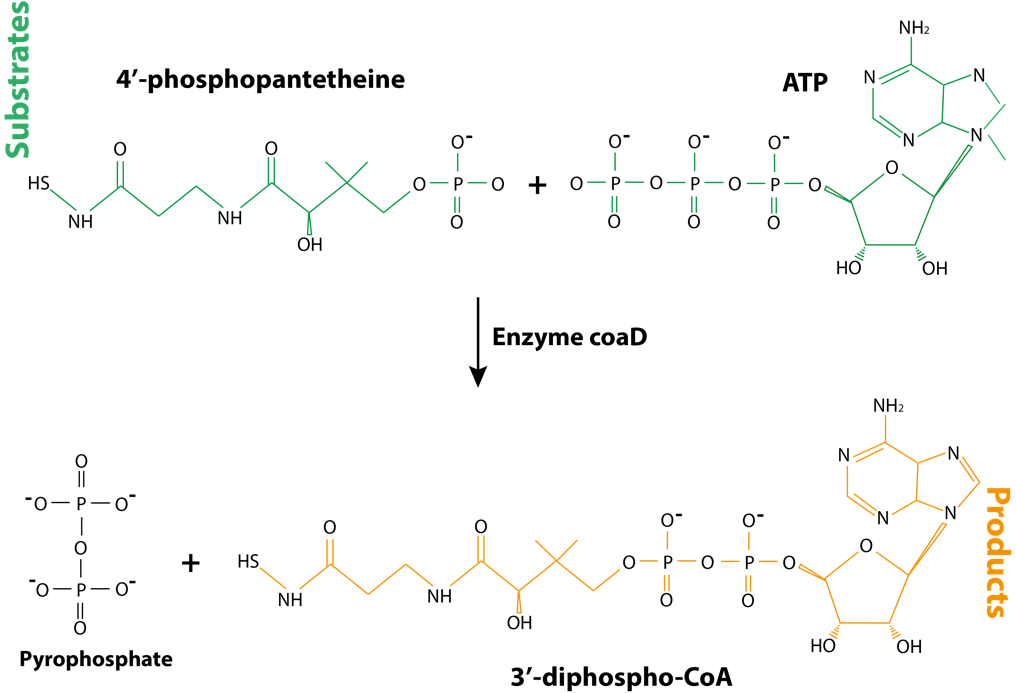
Fig. 4.3 3’-diphospho-CoA, the product of enzymatic reaction catalyzed by CoaD enzyme, is structurally similar to the substrates ATP and 4’-phosphopantetheine.#
4.2.2. Transition states and competitive inhibition applied to drug design#
Chapter 3.5 explained why the active sites of efficient enzymes are often more complementary to reaction transition states than to substrates. As a consequence, when the research objective is to design an effective competitive inhibitor (e.g. for a medicinal drug aimed at inhibiting an enzyme) an effective approach is to design a compound that is structurally and electrostatically similar to the transition state. Because enzyme active sites are more complementary to transition states than to substrates, such a compound should bind the active site with higher affinity than even the substrate – in other words, the EI complex will be much more thermodynamically stable than the ES complex. Knowing the catalytic mechanism of an enzyme is valuable for inferring the structure of the transition state and therefore extremely useful for medicinal drug design.
The enzyme fructose biphosphate aldolase catalyzes the fourth step of the glycolysis pathway, the hydrolysis of fructose 1,6-biphosphate into glyceraldehyde 3-phosphate and dihydroxyacetone phosphate (Fig. 4.4):
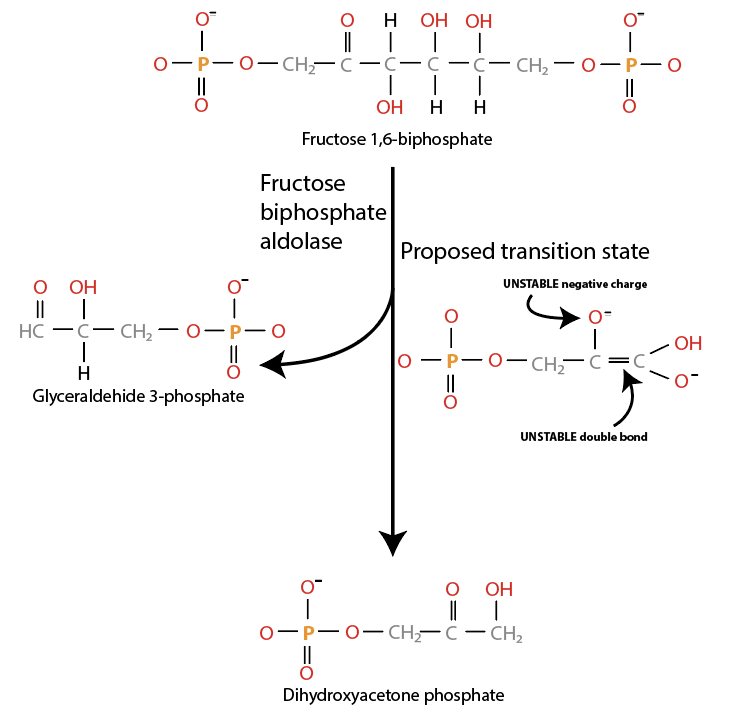
Fig. 4.4 Fructose biphosphate aldolase catalyzes production of dihydroxyacetone phosphate.#
Knowledge of the structure of the transition state allows design of a stable chemical analog that structurally and electrostatically resembles the transition state or a reaction intermediate (Fig. 4.5):
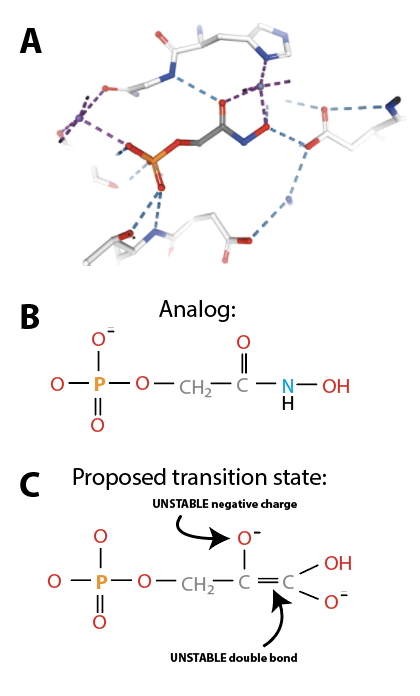
Fig. 4.5 (A) active site of fructose biphosphate aldolase in complex with phospoglycolehydroxyamate, a transition state analog developed as inhibitor. PDB 1B57 [4]. (B) Structure of phospoglycolehydroxyamate, compare with (C) structure of reaction transition state.#
Importantly, such inhibitors should have a similar structure to transition intermediates, but the former must be much more chemically stable than the latter. For this reason, inhibitors designed to mimic transition states are called transition state analogs.
Transition state analogs are very powerful competitive inhibitors: thanks to their stability and their structural similarity to transition states, analogs can bind with a \(10^2\) to \(10^8\) times higher affinity than substrates, generating a very tightly bound \(EI\) complex.
Inhibiting an enzymatic reaction is of special importance when the reaction product is undesired. The inhibitors can be then commercialized as treatment for a disease; this is the case of the HIV protease inhibitors. HIV is the lentivirus that leads to AIDS, a deadly pandemic that emerged in the 1980s. The treatment for HIV, developed much more recently, involves a class of drugs which inhibit an essential step in HIV replication. Several HIV proteins are expressed as a single peptide that is subsequently cleaved by a protease (an enzyme that hydrolyses peptide bonds) that is also generated by the virus. The protease reaction breaks the precursor into individual proteins that then continue HIV replication within the host cell. The reaction is depicted in Fig. 4.6:
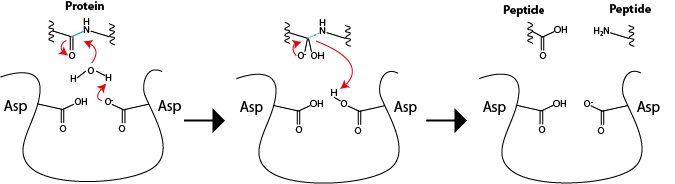
Fig. 4.6 Left: The active site of HIV protease includes two aspartates that promote hydrolysis of peptide bonds (in blue) of the host proteins. Center: the reaction promotes formation of an unstable, tetrahedral transition state that results in collapse of the peptide bond (right) and the release of the peptides moieties with consumption of one molecule of water.#
The transition state inspired the design of several antiviral drugs:
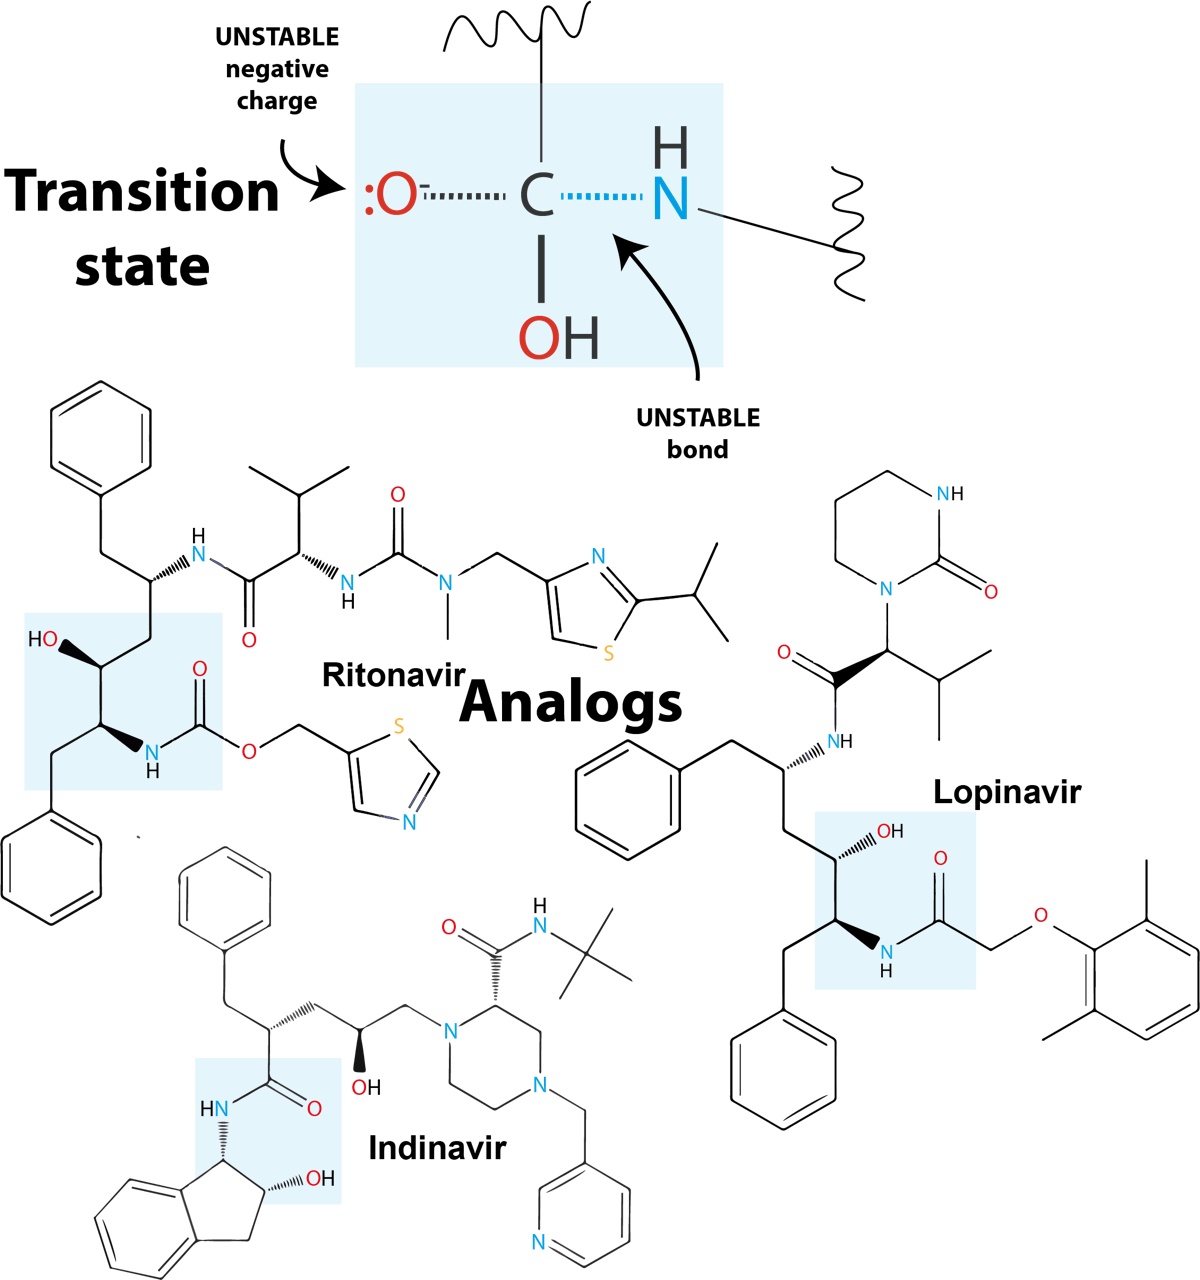
Fig. 4.7 HIV protease inhibitors include peptide-like, non-hydrolysable bonds, highlighted in light blue boxes.#
These transition state analogs are similar enough to the target sequence of the enzyme to be able to stably occupy the active site of the HIV protease and inhibit the cleavage of the virus proteins in the host cells. Without the protease reaction, HIV cannot replicate.
4.3. Uncompetitive inhibition and enzyme kinetics#
Inhibitors that compete for substrate binding sites can be “outcompeted” by increased substrate concentration. Theoretically, this means that reaction velocity can still approach \(V_{\text{max}}\) despite the presence of competitive inhibitor if the substrate concentration is sufficiently high. However, the effects of many inhibitors on enzyme kinetics cannot be completely overcome by increased substrate concentrations. These inhibitors are known as uncompetitive inhibitors.
How could an uncompetitive inhibitor decrease the reaction rate in a way that cannot be overcome by increased substrate concentration? The notion of uncompetitive inhibitors is more relevant to enzymes that bind two or more substrates (Fig. 4.8):
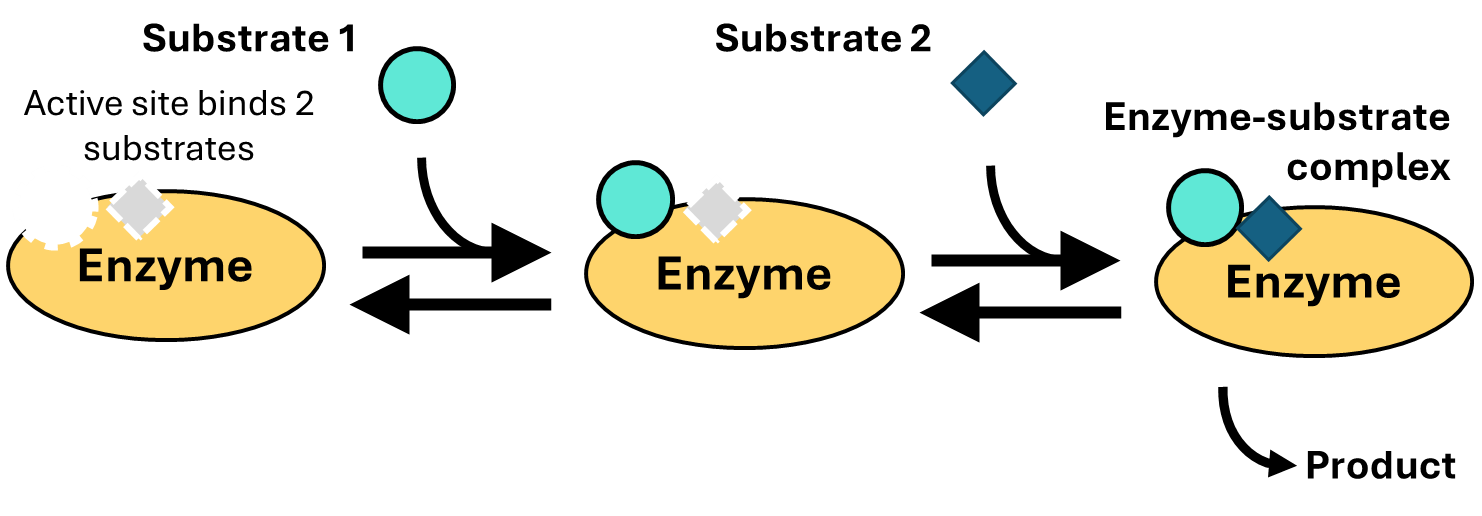
Fig. 4.8 . An example of a two-substrate reaction.#
Many enzymes catalyze two-substrate reactions. An example is lactate dehydrogenase, which you’ve encountered in Chapter 3. To understand how uncompetitive inhibitors can slow a reaction without competing for substrate binding, consider the scheme depicted in Fig. 4.8: two substrates first bind the enzyme sequentially (so substrate 1 must bind before substrate 2) before reacting to form product. Now imagine that we have an inhibitor that binds the part of the active site that binds with substrate 2 (Fig. 4.9):
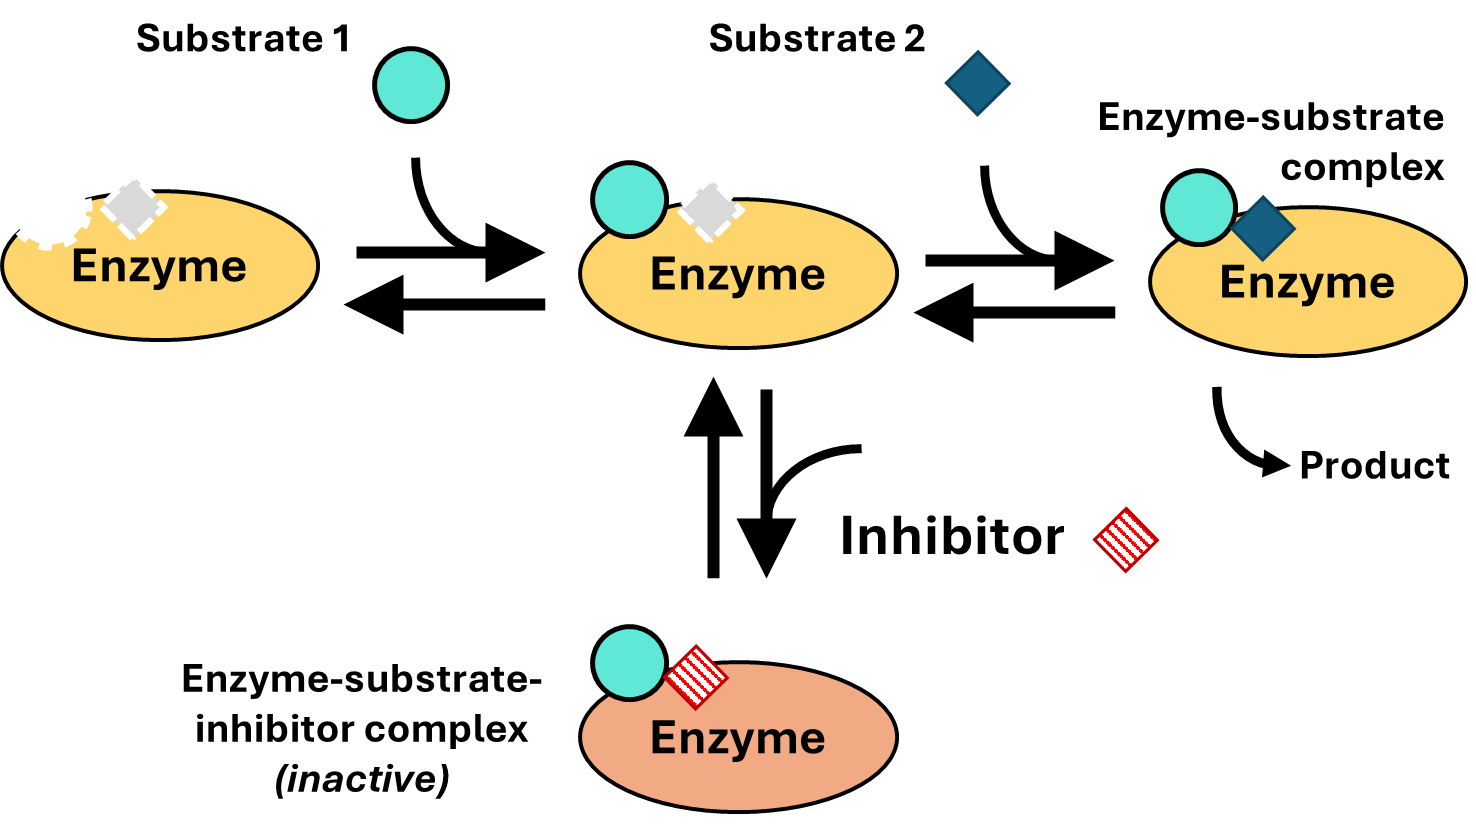
Fig. 4.9 .#
As you can see, the inhibitor binds the \(ES\) complex (formed between the enzyme and substrate 1) to create an inactive enzyme-substrate-inhibitor (\(ESI\)) complex. To understand why this is called uncompetitive inhibition, note how the inhibitor does not compete against substrate 1 for the active site. Conversely, substrate 1 does not interfere with inhibitor binding. Thus, in the scheme above, the form of inhibition would be called “uncompetitive inhibition with respect to substrate 1.” Inhibitors that bind the enzyme-substrate \(ES\) complex are called uncompetitive inhibitors.
NEED TO KNOW
Uncompetitive inhibitors slow down enzymatic reaction by binding to the ES complex and inactivating it for product production.
Just like competitive inhibition, uncompetitive inhibition can be accounted for in the Michaelis-Menten equation:
where
and
is the uncompetitive inhibition constant \({K'}_I\).
Unlike competitive inhibitors, uncompetitive inhibition cannot be overcome by the addition of more substrate. This has the apparent effect of decreasing the maximum velocity achievable by the enzyme – in other words, uncompetitive inhibition resembles a decrease in \(V_{\text{max}}\) (Fig. 4.10).
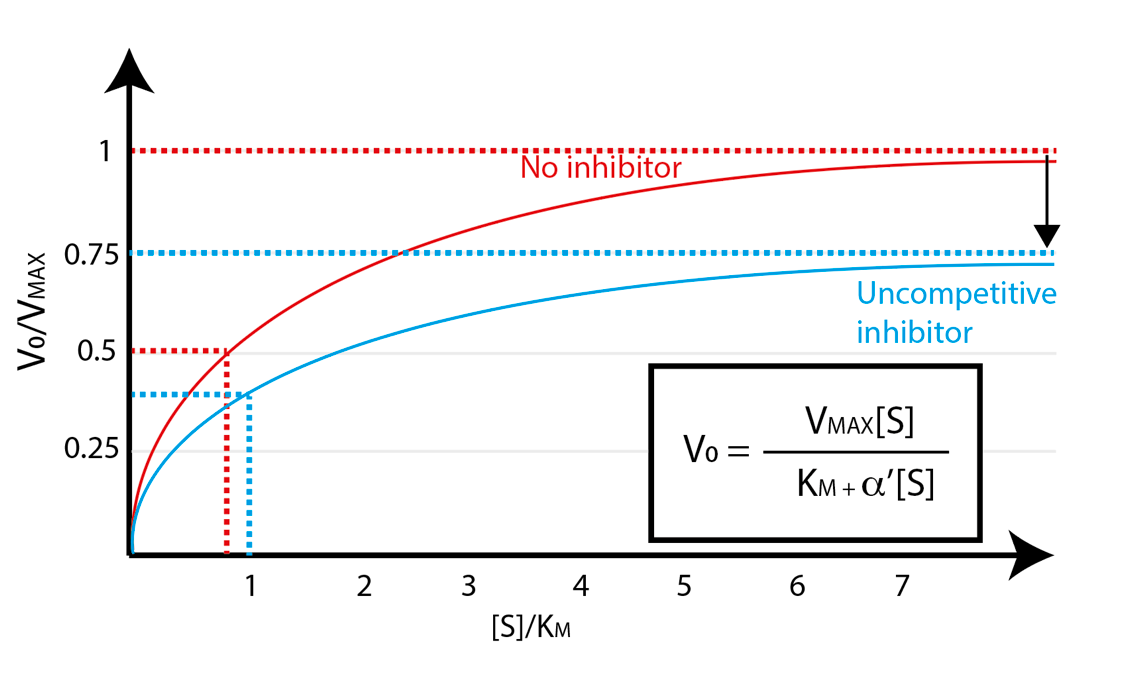
Fig. 4.10 Uncompetitive inhibition lowers enzyme maximum velocity Vmax.#
A digression into two-substrate reactions for those of you wondering how uncompetitive inhibitors slow down reactions.
How would the scheme depicted in Fig. 4.8 and Fig. 4.9 actually work in terms of protein structure? And why would an enzyme capable of binding two substrates bind them in a specific order? (In other words, why would an enzyme bind substrate 2 only after substrate 1 was present in the active site?) As you will learn in Chapter 5, for many enzymes substrate binding changes the overall structure of the enzyme. Such changes can range from small local rearrangements of side chains to dramatic conformational alterations that reshape the entire protein. This phenomenon is called induced fit and will be elaborated upon in the next chapter. In the case presented in Fig. 4.8, imagine that the binding of the first substrate changes the structure of the enzyme in a way that allows the second substrate to bind. Without Substrate 1, perhaps the part of the active site that binds Substrate 2 is closed to the solution or too confined to fit Substrate 2. This structure change induced by binding Substrate 1 would also allow the inhibitor to bind – and in doing so, form the inactive ESI complex.
This type of ordered sequential reaction where different substrates must bind an enzyme active site in a defined sequence is ubiquitous in biochemistry and is important for understanding reaction mechanisms. However, there are also many two-substrate enzymes that bind their substrates in no particular order – so-called random sequential reactions. As you can probably guess, these different reaction mechanisms have very different rate equations. Exploring these different mechanisms is interesting but well beyond the scope of an introductory biochemistry course!
4.4. Allosteric regulation#
So far we have described modes of inhibition that are mediated by molecules interacting with the enzyme active site in one way or another. Typically, the inhibitors that do so will structurally resemble the substrate (or co-substrate in the case of uncompetitive inhibition). However, many enzymes are also be inhibited by molecules that do not have any structural resemblance to any of the substrates. Since active site structures are generally specific for the substrate (if not perfectly specific), this means that the inhibitor must bind to an alternative site located on a different part of the enzyme. This mode of regulation is known as allosteric regulation, and is so named because it involves binding a regulator to a site other than the active site – specifically, from the Greek allos (meaning “other”) and stereos (“solid object”). Note that allosteric regulation can both inhibit enzyme activity (allosteric inhibition) or activate enzyme activity (allosteric activation), depending on the enzyme. The ligand molecule that binds to the allosteric site and regulates enzyme function is called an allosteric regulator.
How does allosteric regulation work in terms of protein structure? For allosteric inhibitors, binding to the allosteric site changes the overall conformation of the enzyme in a way that somehow prevents catalysis. This can happen in various ways: the active site may collapse to entirely prevent substrate binding, or perhaps catalytic residues within the active site change position so they no longer stabilize the transition state. Either way, the allosteric inhibitor is able to control enzyme activity, with higher concentrations of allosteric inhibitor exerting a stronger effect on enzyme activity.
NEED TO KNOW
Some enzymes are regulated by allosteric sites that are distinct from their active sites. Allosteric regulators that bind to trigger conformational modifications that change enzyme structure, which in turn affects the active site and reaction velocity.
Often, allosteric regulators will trigger structural changes so large, that these changes will affect the entire protein structure. This is the case of aspartate transcarbamoylase (ATCase). The enzyme ATCase catalyzes synthesis of N-carbamoylaspartate. ATCase is a heteromultimer composed by 6 catalytic subunits and 6 regulatory subunits. Therefore, there are 6 active sites on the surface of the enzyme where the substrates can bind the enzyme. The enzymatic catalysis is enhanced by ATP and inhibited by CTP:
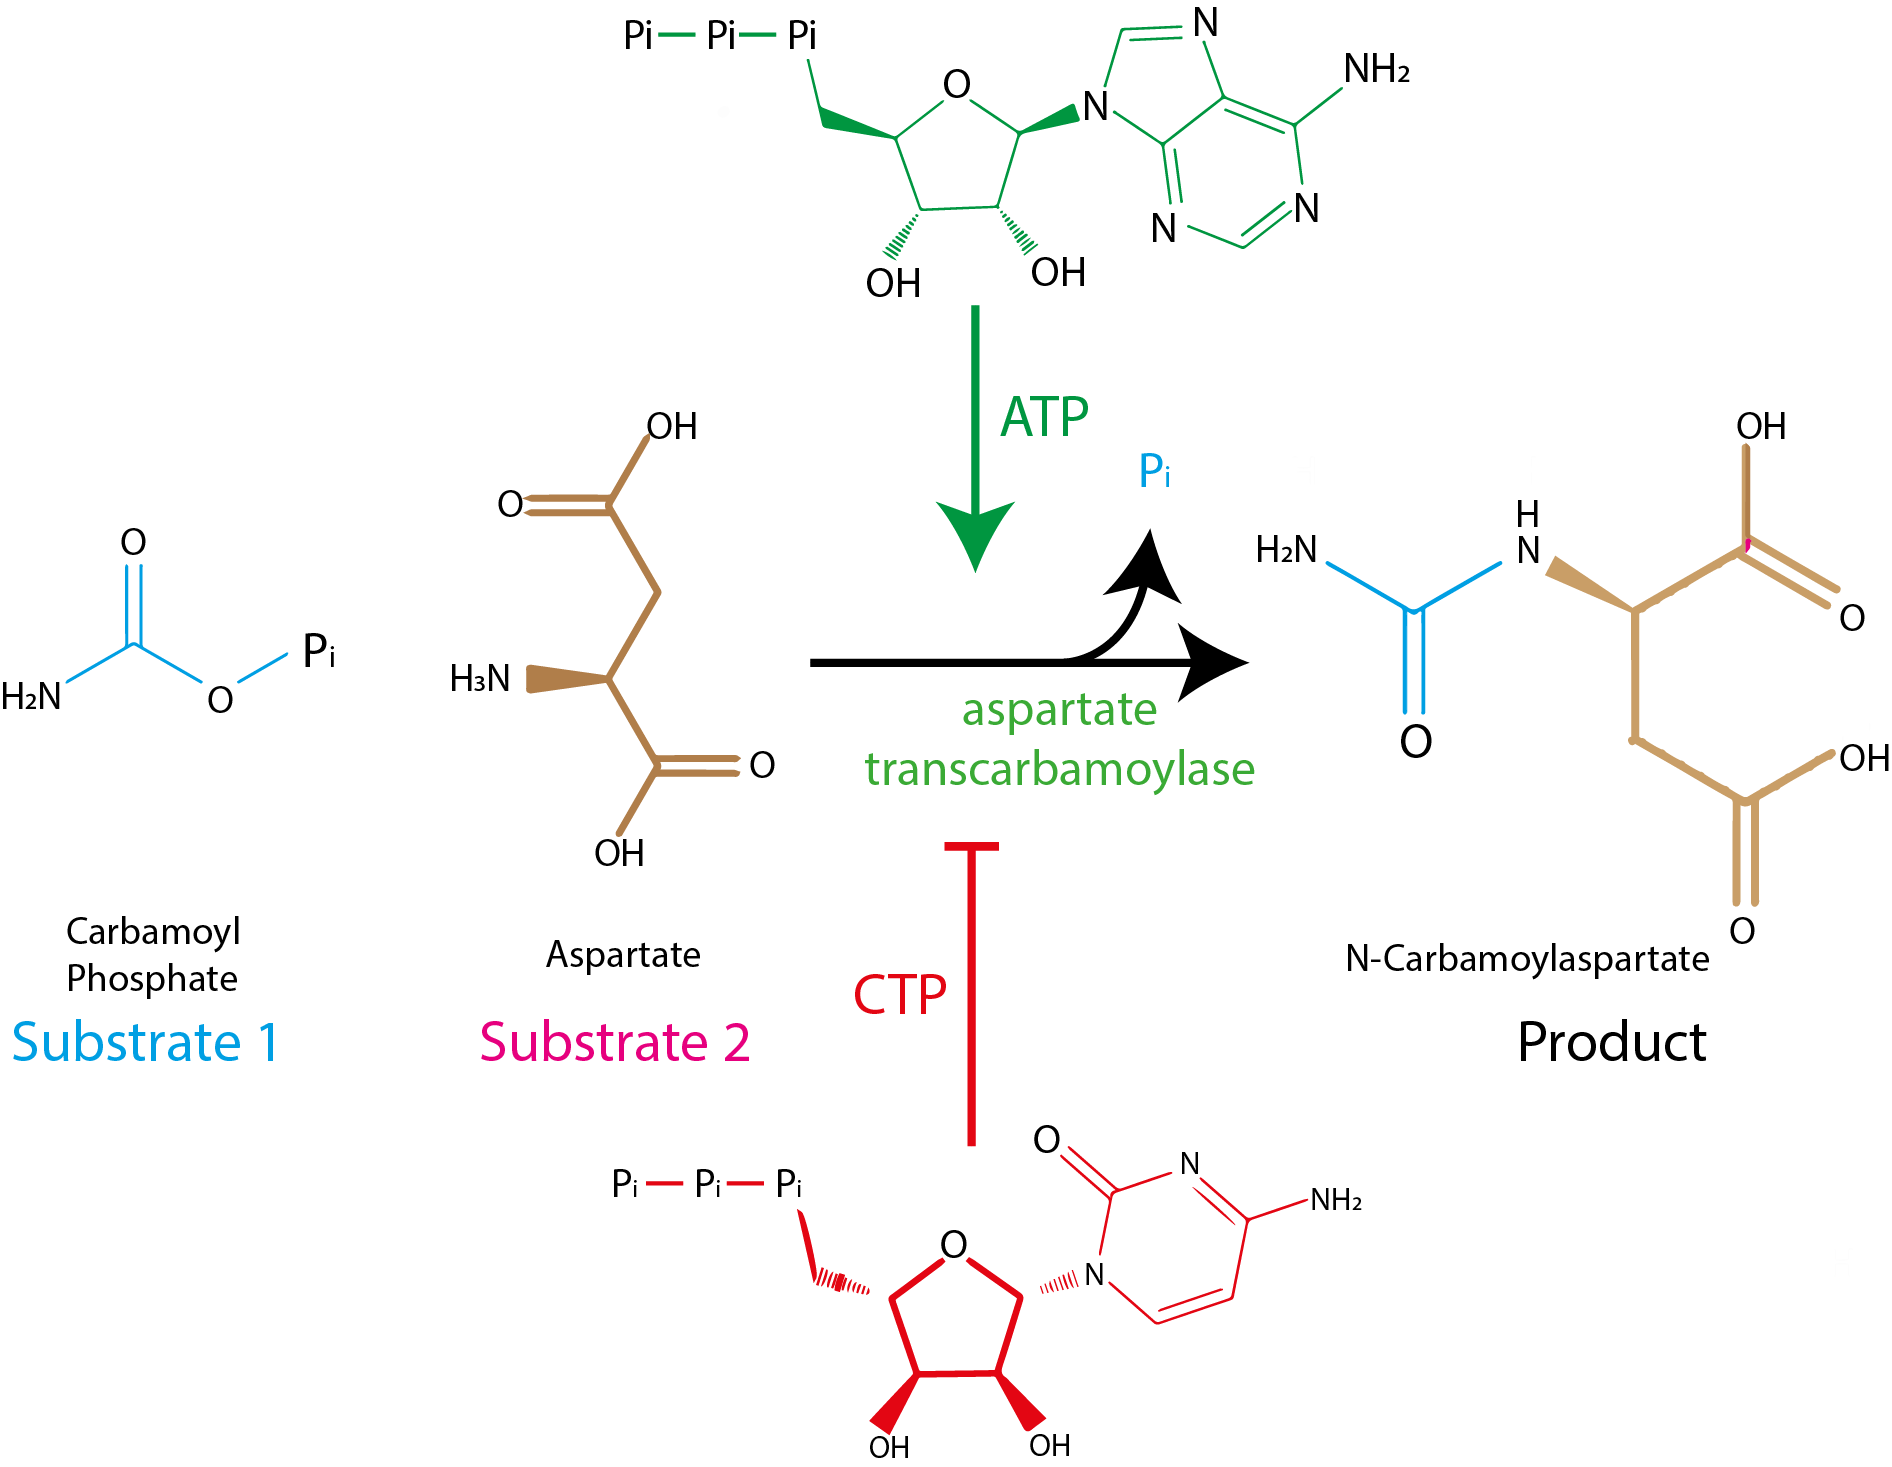
Fig. 4.11 The structure of allosteric regulators ATP (allosteric activator) and CTP (allosteric inhibitor) does not bear any resemblance to the substrates or products of ATCase.#
The structures of the allosteric regulators CTP and ATP do not resemble the ATCase substrates. Thus, it is hard to imagine how CTP and ATP might bind the ATCase active site, which should be specific for the substrates carbamoyl phosphate and aspartate. Thus, ATP and CTP need to bind an allosteric site instead. How does allosteric regulators influence the activity of ATCase?
Let’s consider the structure of ATCase in the absence of the CTP inhibitor (Fig. 4.12, left). The substrate molecules (yellow spheres) are bound in the active sites circled in green. Notice the large empty space between the two green circles: this is space for the substrates to diffuse in and out of the active sites.
Now consider the structure of ATCase when bound to the allosteric inhibitor CTP (Fig. 4.12, right). CTP binds at allosteric sites (red circles) that are distant from the active sites, which are now largely empty of substrate. Note in particular how the empty space between the active sites has now collapsed. This collapse likely explains how the CTP binding deactivates ATCase: the structural change induced by binding to the allosteric site prevents the substrates from finding the active sites by diffusion.
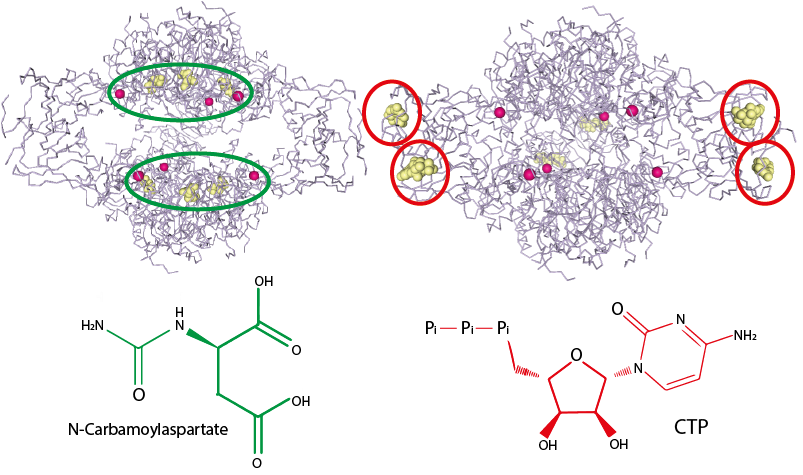
Fig. 4.12 The active site (left, green) and the allosteric site (right, red) are found in different clefts on the surface of ATCase, which explains why substrate/products and inhibitor don’t share structural similarities. In the absence of CTP (left), the enzyme is free to bind the substrate on the active site, indicated by the green area. Binding of CTP (right) on the allosteric site (right, red areas) trigger conformational changes of the whole enzyme that closes up the active site, now less easily available to substrate binding. The inhibitor binding stimulates broad conformational modifications in the enzyme structure, that eventually reverberate through to the active site. Left: PDB structure 1D09 [5]; right: PDB structure 4FYW [6].#
This explains how CTP is able to deactivate ATCase. But how does ATP increase the activity of ATCase? This can also be understood when looking at a structure of ATP-bound ATCase (Fig. 4.13):
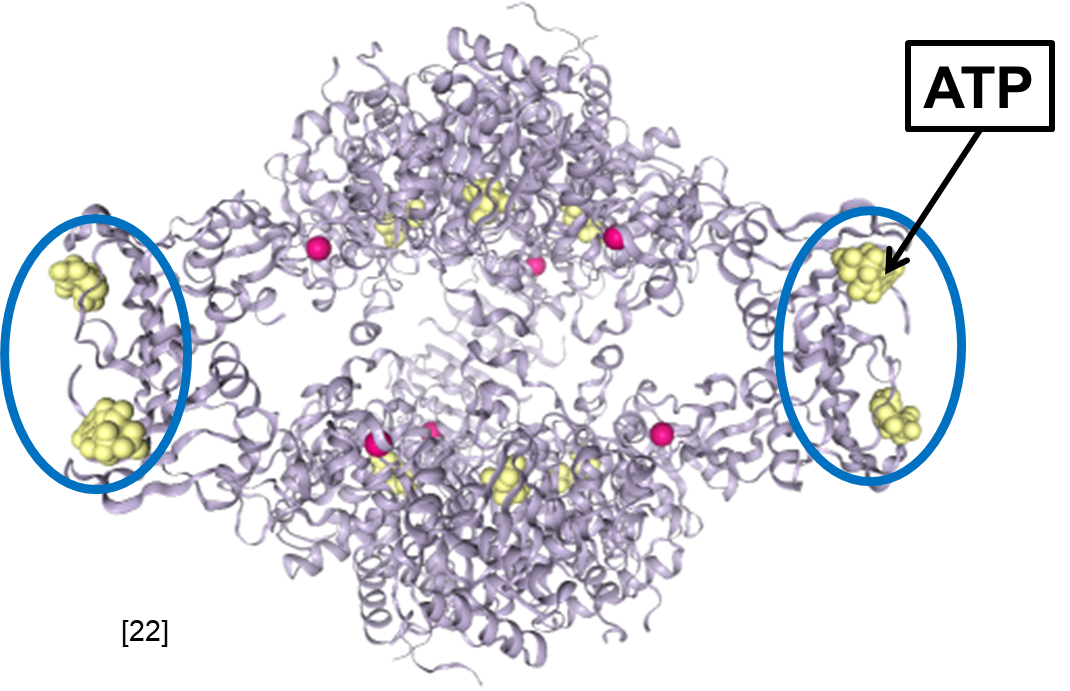
Fig. 4.13 Active structure of E. coli ATCase with allosteric activator ATP bound to the allosteric site. PDB structure 4KGV [7].#
Note how ATP binding in the allosteric sites has locked ATCase in an open configuration, ensuring that substrates can diffuse to the active site and thereby allowing the reaction to proceed.
This hopefully clarifies how ATP increases ATCase activity while CTP decreases activity. But how would ATP increase the rate of the ATCase reaction over the condition where there is no ATP or CTP present? This is an important question that gets to the heart of the nature of enzyme structure. In general, enzyme structures are somewhat flexible. Allosterically-regulated enzymes are particularly flexible, as they have evolved to change structure in response to an allosteric regulator. ATCase likely fluctuates between an active and an inactive state where the active sites are open and closed, respectively (Fig. 4.14). In this scenario where there are no allosteric regulators present, the activity of the enzyme is reduced because at any given instant some fraction of the enzyme population has transiently entered the inactive state. Allosteric regulators control enzyme activity by stabilizing either the active state or the inactive state – in effect, shifting the active/inactive equilibrium by a magnitude determined by the regulator concentration. Specifically, ATP would lock the ATCase structure in an open state while CTP would lock ATCase in the closed state.
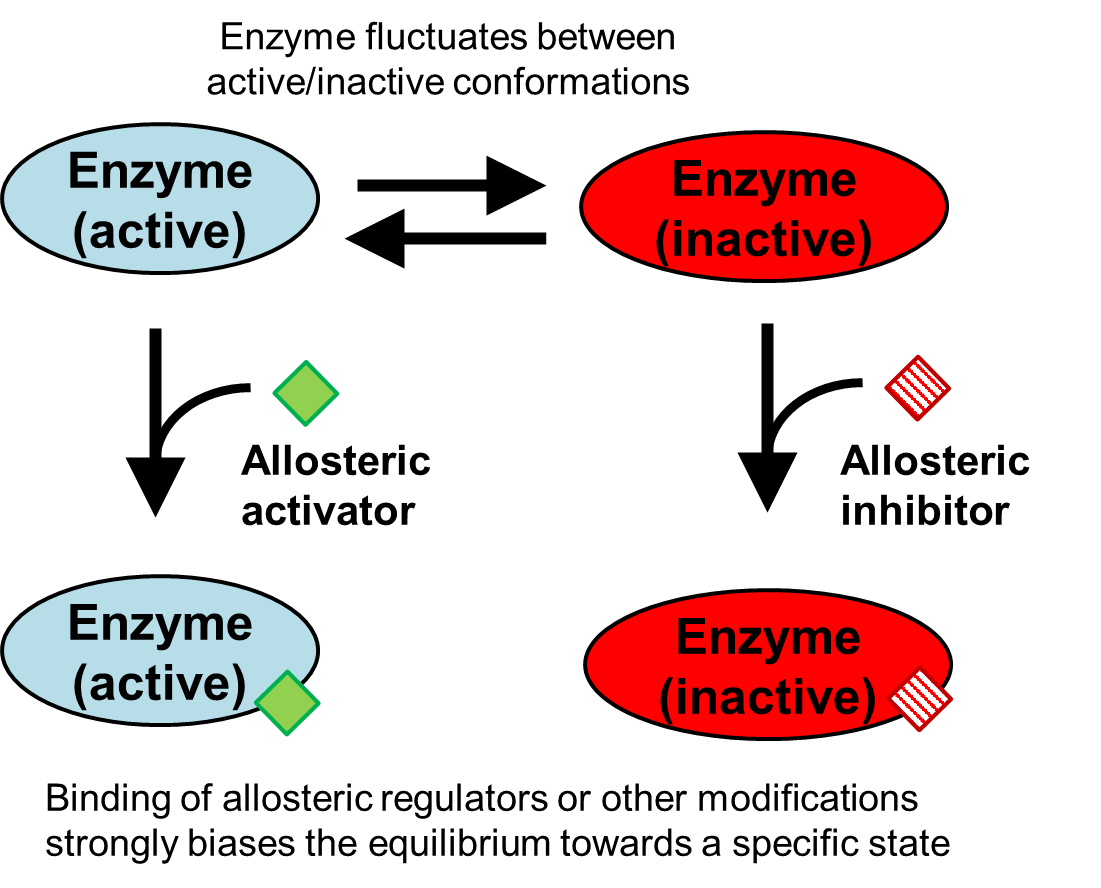
Fig. 4.14 .#
Because of this ability to be locked in one state or the other, allosteric enzymes often act as ‘biochemical valves’ between different metabolic pathways, steering the metabolism of the cell towards one pathway or the other depending on the surroundings - and depending on the concentrations of their substrate(s) and allosteric regulators.
What do the Michaelis-Menten curves look like for allosteric regulation? This differs from enzyme to enzyme, making it difficult to obtain a universal equation that describes allosteric regulation for all allosterically-regulated enzymes. Furthermore, allosteric regulation often exhibits characteristics of both competitive inhibition and uncompetitive inhibition, which further complicates the picture. Nevertheless, the effects of allosteric regulation are apparent from plots of velocity versus substrate concentration in the presence and absence of the allosteric inhibitor CTP (Fig. 4.15):

Fig. 4.15 Adding CTP to the reaction in Fig. 4.11 results in 50% reduction of enzyme velocity when the same amount of substrate is used.#
Allosteric activation of ATCase by ATP is also apparent from plots of reaction velocity versus substrate concentration (Fig. 4.16):

Fig. 4.16 Adding ATP to the reaction in Fig. 4.11 results in 50% increase of enzyme velocity when the same amount of substrate is used.#
Structure fluctuations explain the enzyme kinetics in absence of allosteric regulators ATP and CTP as an average of active/inactive states (compare control curves in Fig. 4.15 and Fig. 4.16).
4.5. Allosteric regulation in metabolism#
We have seen how inhibition is a physiologically important mechanism for enzyme regulation in metabolism. We have seen different ways in which competitive and uncompetitive inhibition occurs in cells. How does allosteric control acts to the same goal? Why is allostery useful in a metabolic pathway?
In the absence of regulation, an enzyme will continue to catalyze a reaction and convert substrate to product until chemical equilibrium is reached. This is detrimental to an organism for many reasons: for instance, the product may be toxic at high concentrations, synthesis may consume compounds with high transfer potentials (such as ATP or acetyl-CoA), or the substrate may be shared between many essential metabolic pathways such as amino acid and fatty acid biosynthesis.
Let’s illustrate this further by placing the ATCase reaction in its metabolic context (Fig. 4.17). ATCase catalyzes one of the earliest reactions within the pyrimidine biosynthesis pathway that eventually generates the essential ribonucleotides UTP and CTP. The ability of UTP and CTP to inhibit ATCase means that once a particular intracellular concentration of UTP and CTP is obtained, these allosteric inhibitors will bind the allosteric site of ATCase and arrest production. A less-obvious aspect of allosteric inhibition is that ATCase will be quickly re-activated if UTP and CTP concentrations decrease. Thus, concentrations of UTP and CTP can be rigorously maintained at defined concentrations by allosteric regulation. Furthermore, because activation and deactivation occurs on the timescale of small molecules diffusing inside the cytoplasm (i.e., very rapidly!) allosteric regulation is extremely responsive to any metabolic shortages. This regulatory motif – in which the final product of a metabolic pathway inhibits an early enzymatic reaction in the pathway – is called feedback inhibition and is ubiquitous across biosynthetic pathways in all kingdoms of life. We will explore this further in Chapter 6.
What is the role of allosteric activation of ATCase by ATP and GTP? Remember that the products of the pyrimidine pathway (UTP and CTP) are two of the four nucleotides incorporated into RNA (including mRNA, rRNA, and tRNA). If the purine nucleotides ATP and GTP accumulate to a high concentration, this may indicate that UTP and CTP concentrations are relatively low. Thus, allosteric activation by ATP and GTP would increase the activity of ATCase and help restore the balance between the four nucleotides.
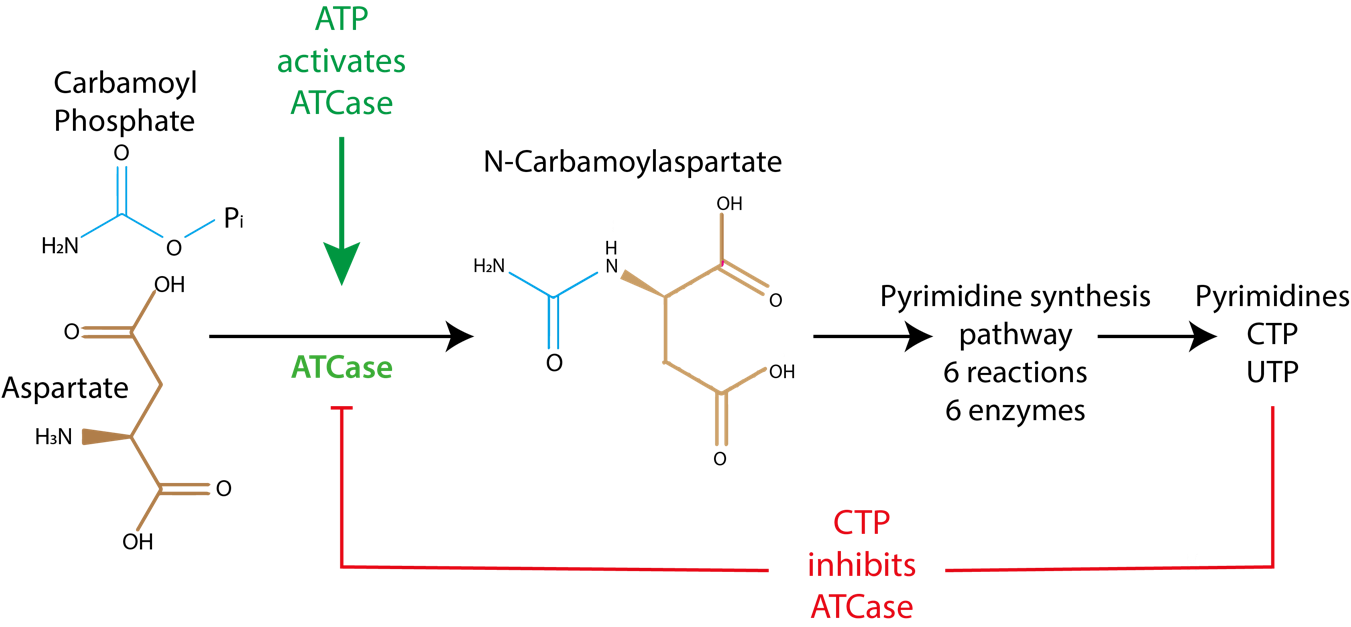
Fig. 4.17 ATCase catalyzes one of the earliest reactions within the pyrimidine production pathway that leads to UTP and CTP starting from aspartate. When [CTP] is high enough, its production will stop.#
Allosteric sites likely evolved to give enzymes a useful metabolic control switch via molecules that do not resemble the substrate (or the transition state) in a way that takes into account the metabolic needs of the cell in a timely manner: as soon as CTP is present in adequate concentration, its production will stop.
4.6. Enzyme regulation via covalent modifications in metabolism#
The preceding sections describe modes of enzyme regulation that are mediated by molecules diffusing into the active site or allosteric site of an enzyme and formation of a bound complex via noncovalent interactions. Such forms of regulation are generally highly reversible and thus extremely sensitive to regulator concentrations – when the concentration of a competitive inhibitor decreases, the enzyme activity will immediately increase if substrate is available. (Of course, some binding interactions can be extremely stable and thus long-lived and less sensitive to concentration changes, but those are interesting exceptions.)
Enzymes can also be regulated by covalent modification such as the formation of an oxygen-phosphorous bond introduced by a phosphate transfer to a serine residue. As covalent bonds are almost always more stable than the collective noncovalent interactions that stabilize molecules within active sites or allosteric sites, covalent modifications can exert long-lasting control over enzyme activity that is not necessarily sensitive to short-term fluctuations in metabolite concentrations.
Since these covalent modifications occur on proteins after their translation by ribosome is complete, they are collectively known as post-translational modifications (PTMs). Such modifications alter the properties of the enzyme to different degrees: the modification may impair stability of the enzyme targeted for modification, or change the electric charge or the structure of its surface; a covalent modification may activate or deactivate proteins, support or impair binding or dimerization, or target the enzyme for degradation, or cause the enzyme to be transported to a different cellular compartment.
Covalent protein modifications are performed by different classes of enzymes that use target enzymes as substrates. The groups transferred to the substrate proteins are generally obtained from metabolites such as ATP or acetyl-CoA. Several classes of covalent modifications are listed in Table 4.2.
Modification |
Class of enzymes |
Chemical group added |
Target residue(s) |
|---|---|---|---|
Phosphorylation |
Kinases |
-OPO3- |
|
Acetylation |
Acetyltransferases |
-CH3 -C=O |
|
Adenylation |
Adenylate-forming enzymes |
Adenosine monophosphate (AMP) |
|
Glycosylation |
Multiple classes of enzymes |
Sugars |
Varies depending on the sugar-peptide bond:
|
Ubiquitination |
|
Ubiquitin (76-residues long protein) |
|
Methylation |
Methyltransferases |
-CH3 |
|
Depending on the reactive groups, the reaction chemistry, and the enzymatic mechanism, each modification usually happens on specific target residues. Many modifications can be removed, which is a reaction catalyzed by yet another protein modifying enzyme. For instance, protein kinases transfer phosphates from ATP to enzymes, while protein phosphatases remove phosphates from phosphorylated enzymes.
Covalent modifications have many different effects, occasionally more than one of these at the same time:
Alter physio-chemical properties of the target protein.
Alter the structure or the function of the target protein.
Change the affinity of the target protein for a ligand, a substrate, or other proteins.
Change the affinity of the target protein for other proteins, affecting interactions or self-interaction/multimerizations state.
Address the protein for degradation, change of cellular compartment, or triggers new reactions.
Hundreds more modifications exist; please note that Table 4.2 is not exhaustive!
A. Bar-Even, R. Milo, E. Noor, and D. S. Tawfik. The moderately efficient enzyme: futile encounters and enzyme floppiness. Biochemistry, 54(32):4969–4977, 2015. doi:10.1021/acs.biochem.5b00621.
Alan Fersht. Structure and Mechanism in Protein Science. WORLD SCIENTIFIC, 1999. doi:10.1142/10574.
Rongbao Li, Rachada Sirawaraporn, Penchit Chitnumsub, Worachart Sirawaraporn, Jason Wooden, Francis Athappilly, Stewart Turley, and Wim G.J Hol. Three-dimensional structure of m. tuberculosis dihydrofolate reductase reveals opportunities for the design of novel tuberculosis drugs. Journal of Molecular Biology, 295(2):307–323, 2000. doi:10.1006/jmbi.1999.3328.
David R Hall, Gordon A Leonard, Christopher D Reed, C.Ian Watt, Alan Berry, and William N Hunter. The crystal structure of escherichia coli class ii fructose-1,6-bisphosphate aldolase in complex with phosphoglycolohydroxamate reveals details of mechanism and specificity11edited by r. huber. Journal of Molecular Biology, 287(2):383–394, 1999. doi:10.1006/jmbi.1999.2609.
D. De Vos, P. Hulpiau, B. Vergauwen, S. N. Savvides, and J. Van Beeumen. Expression, purification, crystallization and preliminary x-ray crystallographic studies of a cold-adapted aspartate carbamoyltransferase from moritella profunda. Acta crystallographica. Section F, Structural biology and crystallization communications, 61(3):279–281, 2005. doi:10.1107/S174430910500285X.
G. M. Cockrell and E. R. Kantrowitz. Metal ion involvement in the allosteric mechanism of escherichia coli aspartate transcarbamoylase. Biochemistry, 51(36):7128–7137, 2012. doi:10.1021/bi300920m.
Gregory M. Cockrell, Yunan Zheng, Wenyue Guo, Alexis W. Peterson, Jennifer K. Truong, and Evan R. Kantrowitz. New paradigm for allosteric regulation of escherichia coli aspartate transcarbamoylase. Biochemistry, 52(45):8036–8047, 2013. doi:10.1021/bi401205n.