
3. Enzymes#
3.1. An introduction to enzymes#
The chemical polymers that make up a living organism are assembled from monomers, which are the chemical building blocks of life. The series of chemical reaction that produce these polymers from monomers and basic metabolites is known as anabolism.
Monomers |
Polymers |
|---|---|
Nucleotides |
DNA and RNA |
Amino acids |
Proteins |
Fatty acids |
Membranes and lipids |
Monosaccharides |
Polysaccharides (cellulose, starch…) |
Catabolism supplies anabolism with basic metabolites by breaking down nutrients (e.g. sugar, carbon dioxide, plants, meat, fats). Catabolism also produces chemical energy that is used to power molecular machines and drive unfavorable chemical reactions, such as the anabolic reactions, that assemble monomers into polymers.
NEED TO KNOW
Metabolism is the total of the biochemical reactions taking place in an organism. Catabolic reaction convert polymers and monomers into basic metabolites and fuel in the form of energy carriers. Anabolic reactions convert these basic metabolites into monomers that can be assembled into polymers such as proteins, RNA, and DNA. Both anabolism and catabolism are subsets of metabolism.
The conversions of nutrients to metabolites to monomers to polymers are far too slow to enable life. Therefore, life requires chemical catalysts that accelerate the speed of reactions (i.e. the rate at which reactants are transformed into products). The catalysts that accelerate the chemical reactions needed for life are enzymes. Enzymes accelerate specific chemical reactions by many orders of magnitude. To consider the scale of the acceleration enabled by catalysts: at our body temperature (37°C), the bacteria Escherichia coli is able to build an entire copy of itself from sugar, ammonium, and phosphate salts within 45 minutes. This requires production of about 8 million letters of DNA, many thousands of enzymes, and many millions of phospholipid molecules. Without enzymes, even the first step in the long process of converting sugar into the first basic metabolite would require many years and life would be impossible.
The vast majority of enzymes are proteins that have folded into a specific structure (the so-called native conformation), although a few RNA enzymes exist (including the ribosome). As described below, the folding of proteins is required to arrange the amino acid residues into specific positions that enable chemical catalysis. If the protein is not folded, catalysis is usually not possible, and the protein cannot act as an enzyme.
Enzymes do not only provide speed to chemical reactions. Because the cell must allocate a limited supply of metabolites towards specific needs, which can change based on environmental conditions, the cell must be able to exert tight control over metabolism. Many enzymes are therefore responsive to cellular conditions, and will activate or deactivate according to cellular requirements. Enzymes therefore provide control over metabolism, and this control is also essential for life.
How do cells coordinate and timely complete hundreds of chemical reactions?
How do cells appropriately synchronize their reactions with the environmental stimuli they receive?
Their activity can be precisely and rapidly controlled by external signals, and coordinated within the overall cellular metabolism. In this chapter, we will explore enzyme structure, basics of catalysis and enzyme kinetics.
3.2. Enzymes are catalysts#
What are catalysts? Uncatalyzed chemical reactions are too slow to support life. Let’s have a look at the hydration reaction of urea into ammonia, a common nitrogen by-product of metabolism:

If uncatalyzed (i.e. without enzymes), this reaction takes about 4 years. The enzyme urease accelerates this reaction by a factor of \(10^{14}\), which means that organisms can convert urea into ammonia – a basic building block of life because it is a good source of nitrogen for many species.
Why do chemical reactions need catalysts? Chemical reactions involve the breaking and re-formation of chemical bonds. Because chemical bonds represent a stable configuration of electrons and nuclei, breaking bonds requires an energy investment of \(10^2\) to \(10^3\) \(\text{kJ/mol}\) per bond broken. While much of this energy is often repaid by the formation of new covalent bonds, there exists a transient state in which the covalent bonds of the reactants have been broken but the bonds present in the product molecules have not been formed yet. This stage is called the transition state. The transition state is defined as the least-energetically stable state along the course of the reaction.
Energy diagrams can be useful when thinking about transition states and how their instability determines reaction rates. Transition states exhibit higher chemical potential energy and free energy than both reagents and products. Because reactants must acquire sufficient energy to cross the transition state, the transition state creates an energetic hill that must be climbed for the reaction to proceed to completion.
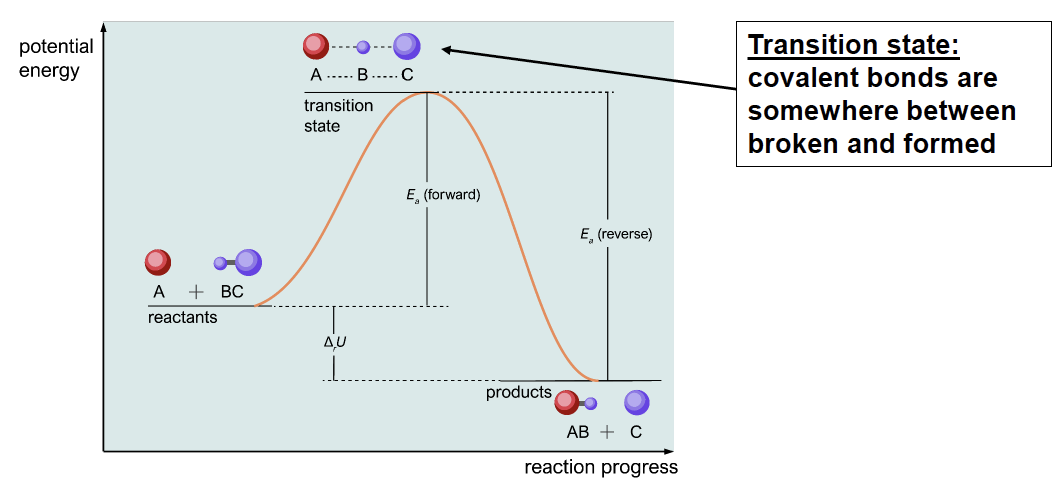
Fig. 3.1 The energetic meaning of transition states.#
The reaction rate is defined by the number of chemical reactions that occur per units of time, or the amount of product generated over units of time. The reaction rate is strongly dependent upon the stability (i.e. the free energy) of the transition state. Reactions that have transition states with higher free energy (i.e. that are more unstable) will require a larger amount of energy to proceed than reactions with lower free energy. Unstable transition states decrease the probability that the reactants will acquire sufficient energy for the reaction to proceed. Therefore, unstable transition states result in fewer reactions in a given span of time, and less product be generated.
The chemical reaction rate is a function of the free energy of the transition state – i.e., the height of the free energy barrier between reactants and products. The relationship that links the rate of the chemical reaction to the free energy of the transition state relative to the reactants (also called the activation energy) is described by the Arrhenius equation:
where:
\(\text{Rate} = k =\) reactions per unit time (usually seconds)
\(A =\) pre-exponential factor
\(R =\) gas constant
\(T =\) temperature in Kelvins
\(E_a =\) activation energy required to reach transition state (difference in free energy between reactants and transition state)
Catalysts accelerate reactions by decreasing \(E_a\), the free energy of the transition state (i.e. by stabilizing the transition state). Fig. 3.2 compares the energy diagrams of the uncatalyzed and catalyzed reactions:
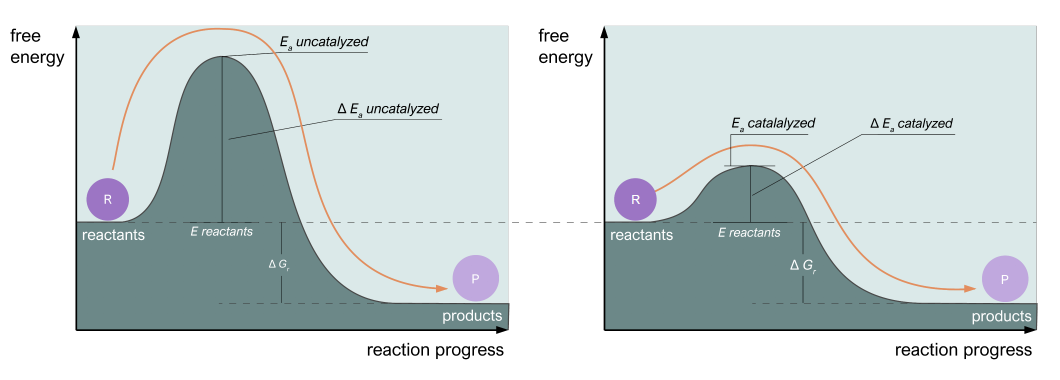
Fig. 3.2 Catalysts work by decreasing the free energy of the transition state. The lower the energy, the more reactions can occur per unit of time, in accordance with Arrhenius’ equation.#
NEED TO KNOW
The rate of a reaction is determined by the stability of the transition state between reactants and products. Enzymes accelerate a chemical reaction by many orders of magnitude in a process called catalysis. Catalysts accelerate reactions by decreasing the free energy of the transition state.
Remember that catalysts do not affect the chemical equilibrium between reactants and products: they only decrease the free energy of the transition state. To illustrate: consider a reaction that reaches 1 mM reactant and 1 mM product at equilibrium. Adding a catalyst (such as an enzyme) to a solution of 1 mM reactant and 1 mM product will not make more product or more reactant. However, adding a catalyst to a solution of 2 mM reactant will allow the system to reach equilibrium (1 mM reactant and 1 mM product) much faster than in the absence of catalyst.
This also means that given a solution of 2 mM product, adding the same catalyst will produce a solution of 1 mM reactant and 1 mM product (i.e. the reaction will run backwards). This is because catalysts lower the energy barrier between reactants and products, the catalyst also facilitates the reverse reaction from products to reactants.
3.3. How do enzymes catalyze reactions?#
Enzyme accelerate chemical reactions by stabilizing transition states. But how does this work, exactly? To answer this question, we have to explore in more detail what makes transition states unstable relative to reactants and products.
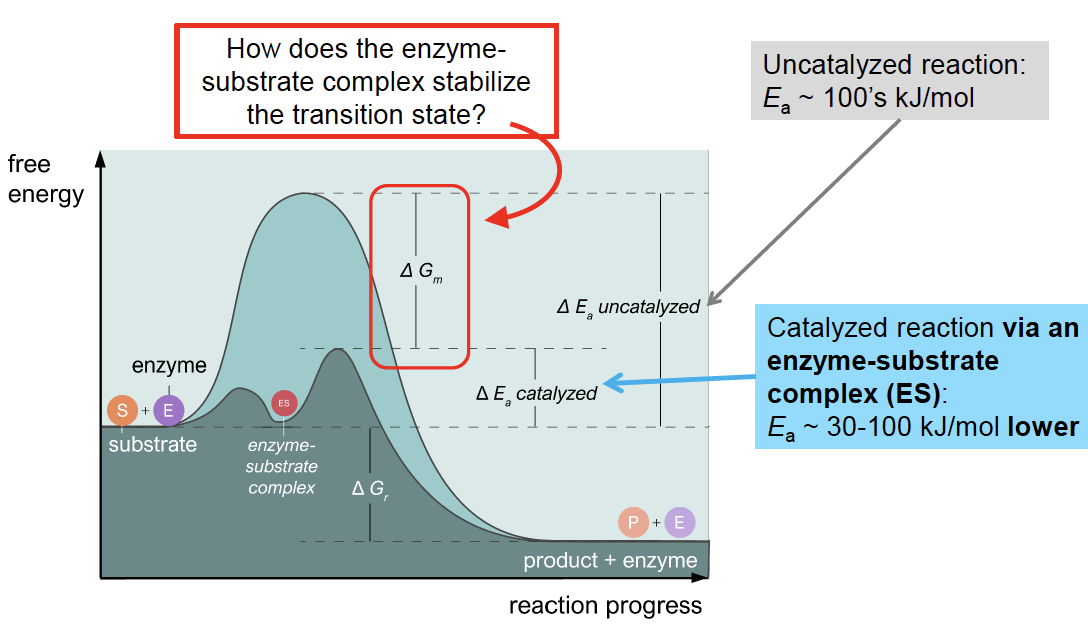
Fig. 3.3 Comparing energy landscape allows to better appreciate how enzymes work.#
Let’s have a look at the reaction catalyzed by lactate dehydrogenase:
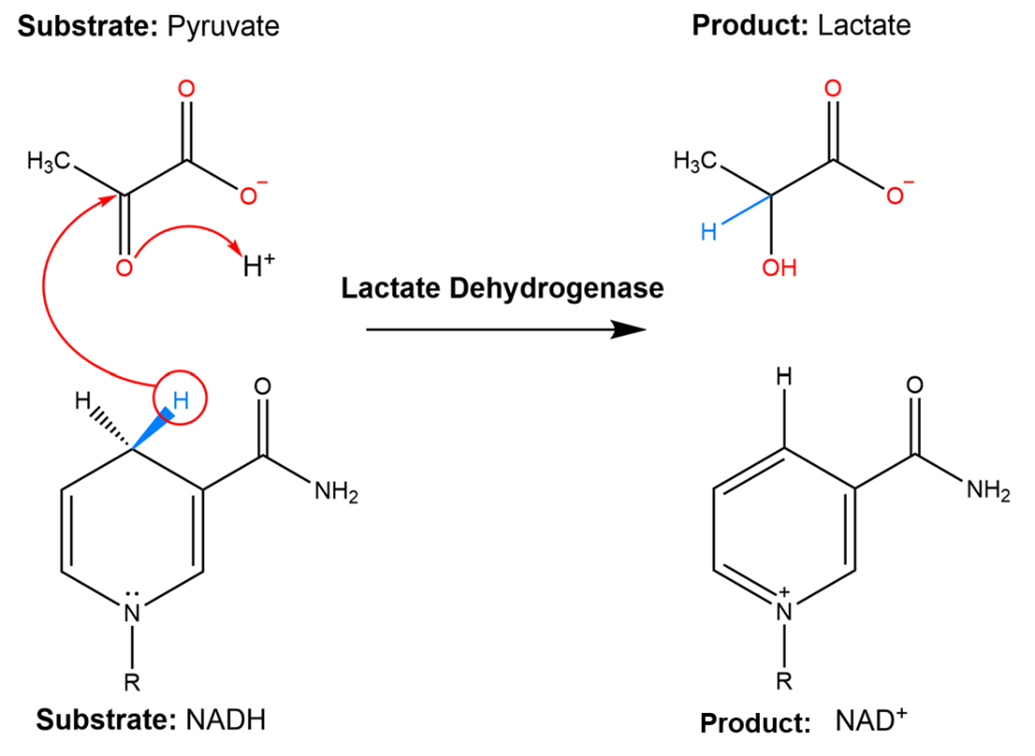
Fig. 3.4 Lactate dehydrogenase catalyzes a reaction with 2 substrates, pyruvate and NADH, to form 2 products, lactate and NAD+.#
Lactate dehydrogenase catalyzes a reaction with 2 substrates (pyruvate and NADH) to form 2 products, lactate and NAD+. To think about what the transition state of this reaction might look like, it can help to consider that transition states are generally thought to resemble hybrid structures of reactants and products. Therefore, the transition state for the conversion of pyruvate to lactate probably looks like the structure in Fig. 3.5:
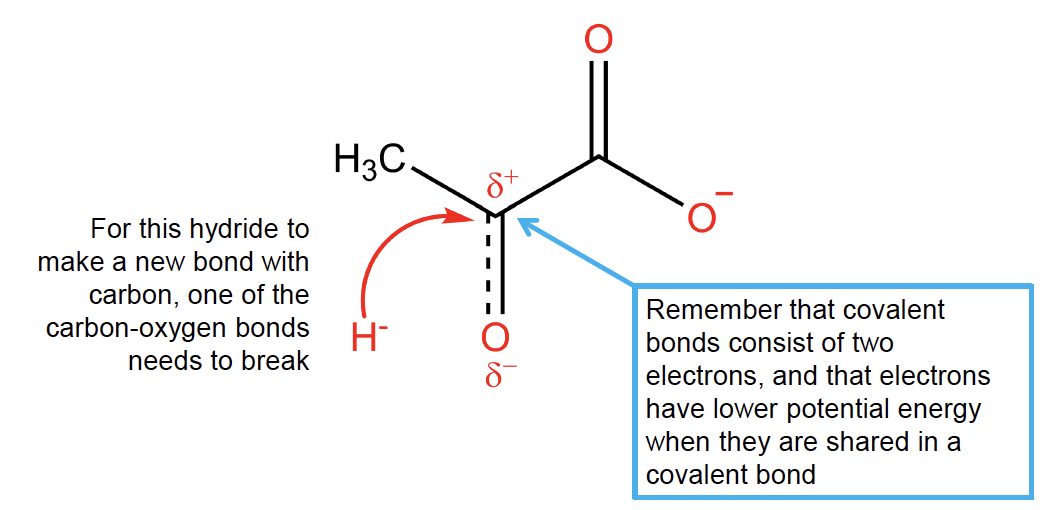
Fig. 3.5 As one of the covalent carbon-oxygen bonds breaks, the negative charge of the electrons shared in the bond accumulates on the more electronegative atom (oxygen). Both breaking a covalent bond and concentrating negative charge on a single nucleus is energetically unfavourable and therefore destabilizing.#
Transition states like the one shown in Fig. 3.5 are unstable. The formation of unstable structure from stable one is energetically unfavourable and therefore unlikely to happen spontaneously at a rate compatible with metabolism. The instability is due to:
a. Covalent chemical bonds being broken. Remember from your chemistry courses that a chemical bond is a stable configuration in which electrons are shared between nuclei.
b. Electric charge being concentrated in a smaller volume, which increases potential energy. You can think of this like trying to push two electrons closer together – since electrons both have negative charge, they will repel each other.
c. Reactants must be placed in a very specific orientation relative to each other. In this case, the pyruvate carbon must be within about one chemical bond length of the hydrogen atom on NADH for this reaction to occur, and it must approach at a specific angle – if the molecules are randomly diffusing within solution, the probability of collisions occurring in just the right way is extremely low.
How can an enzyme stabilize the transition state structure, and by stabilizing it, lower the activation energy? What is the chemical basis for this process?
3.4. Enzyme structures include one (or more) active site(s)#
You have learned how proteins assume a three-dimensional shape (tertiary and quaternary structure) which is based on their primary structure, the amino acid sequence in the polypeptide chain. In their folded conformation, enzymes include specific cavities, or pockets: the active site.
NEED TO KNOW
The active site is the region of the properly-folded enzyme where substrates bind and the enzyme reaction is catalyzed. To be accessible to substrates, they are usually found on the surface of the enzyme. Importantly, the residues that form the active site can be very far away when looking at the linear amino acid chain, and come spatially close together only once the enzyme is folded.
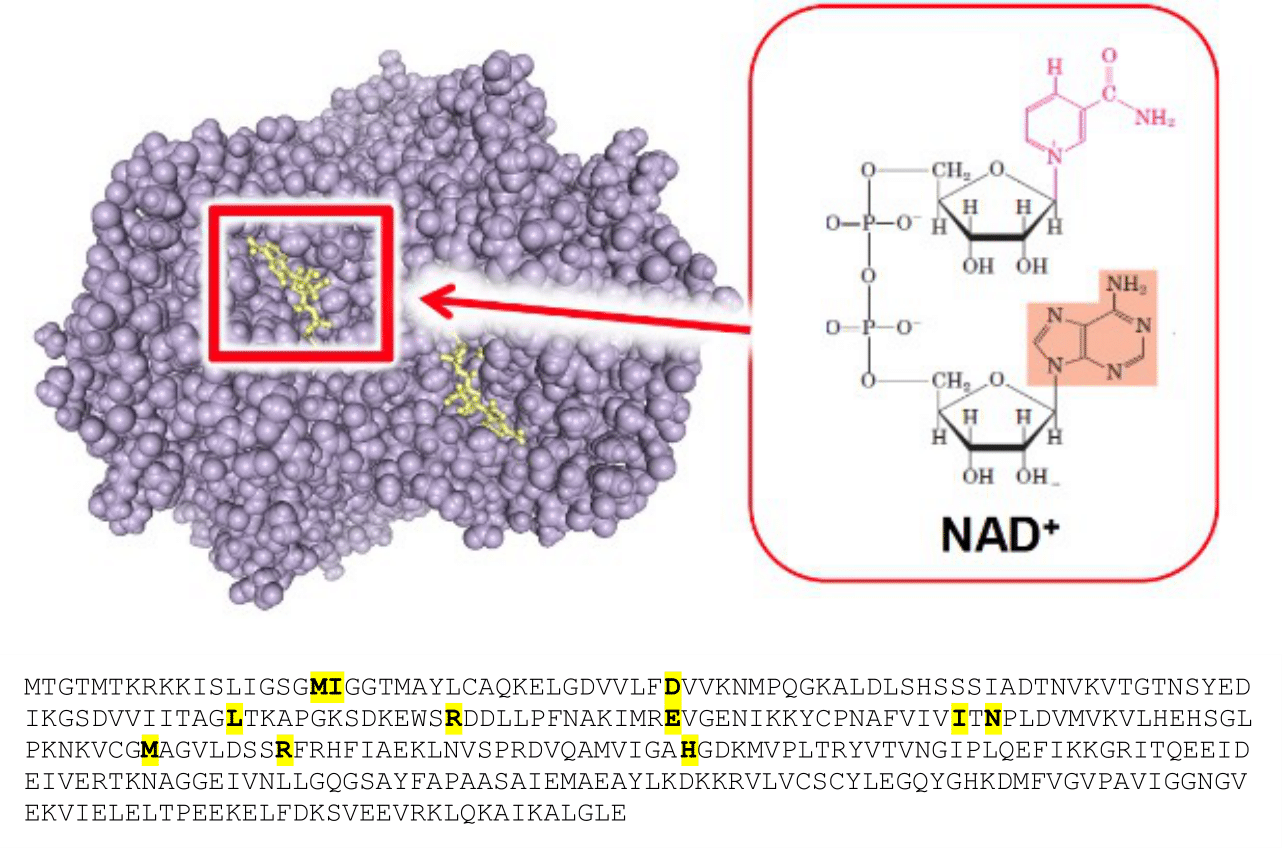
Fig. 3.6 Active sites are often clefts, or pockets on the surface of a globular protein. In the top panel of the figure, structure of ancestral apicomplexan lactate dehydrogenase (purple) with the substrate positioned in the active site (yellow), visualized as one bead per atom (PDB entry: 4PLF). In the bottom panel, sequence of lactate dehydrogenase in which the active site residues are highlighted. Note how they are far apart in the primary sequence (Uniprot entry: A0A075B5G8). PDB structure 4PLF [1].#
The active sites on the protein surface promote binding and retaining of substrate(s) by shape matching and weak chemical interactions that place the enzyme and the substrate close together in an orientation that stabilizes the transition state and accelerates the chemical reaction. Several types of weak molecular interactions (also called weak bonds, as opposed to covalent bonds) contribute to stabilize the transition state and keep the substrates in place. These are the same types of weak interactions that stabilize protein tertiary and quaternary structure. Among these:
Weak interaction |
Energy |
Length |
Amino acid side chains that typically contribute interactions |
|---|---|---|---|
Hydrogen bond |
5-21 kJ/mol |
1.97 Å |
Polar and charged side chains |
Dipole-dipole |
~4 kJ/mol |
~3.5-4 Å |
Polar and charged side chains |
Hydrophobic interactions |
0.1 to 0.2 kJ/mol per Å2 solvent-accessible hydrocarbon surface [2] |
~3.5-4 Å |
Hydrophobic side chains |
Ionic bonds/salt bridge |
Can be very strong |
< 4 Å |
Charged side chains |
Van der Waals interactions |
Greatly vary depending on atom species involved |
~ 3-5 Å |
All side chains |
Some of these bonds, like the hydrogen bond, requires an optimum distance between the atoms involved; others, like the hydrophobic interactions and the van der Waals interactions, decrease as a function of the distance between the atoms.
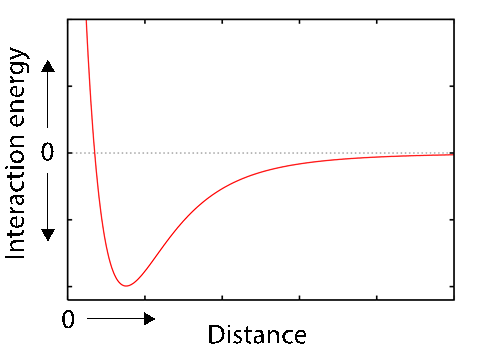
Fig. 3.7 The weak van der Waal intermolecular forces decrease with distance between the atoms/molecules involved.#
By providing both spatial arrangement of substrates and by contributing stabilizing interactions via weak bonds, the active site stabilizes the transition state. Fig. 3.8 show the contribution of Arginine 106 and Histidine 193 to the catalysis:
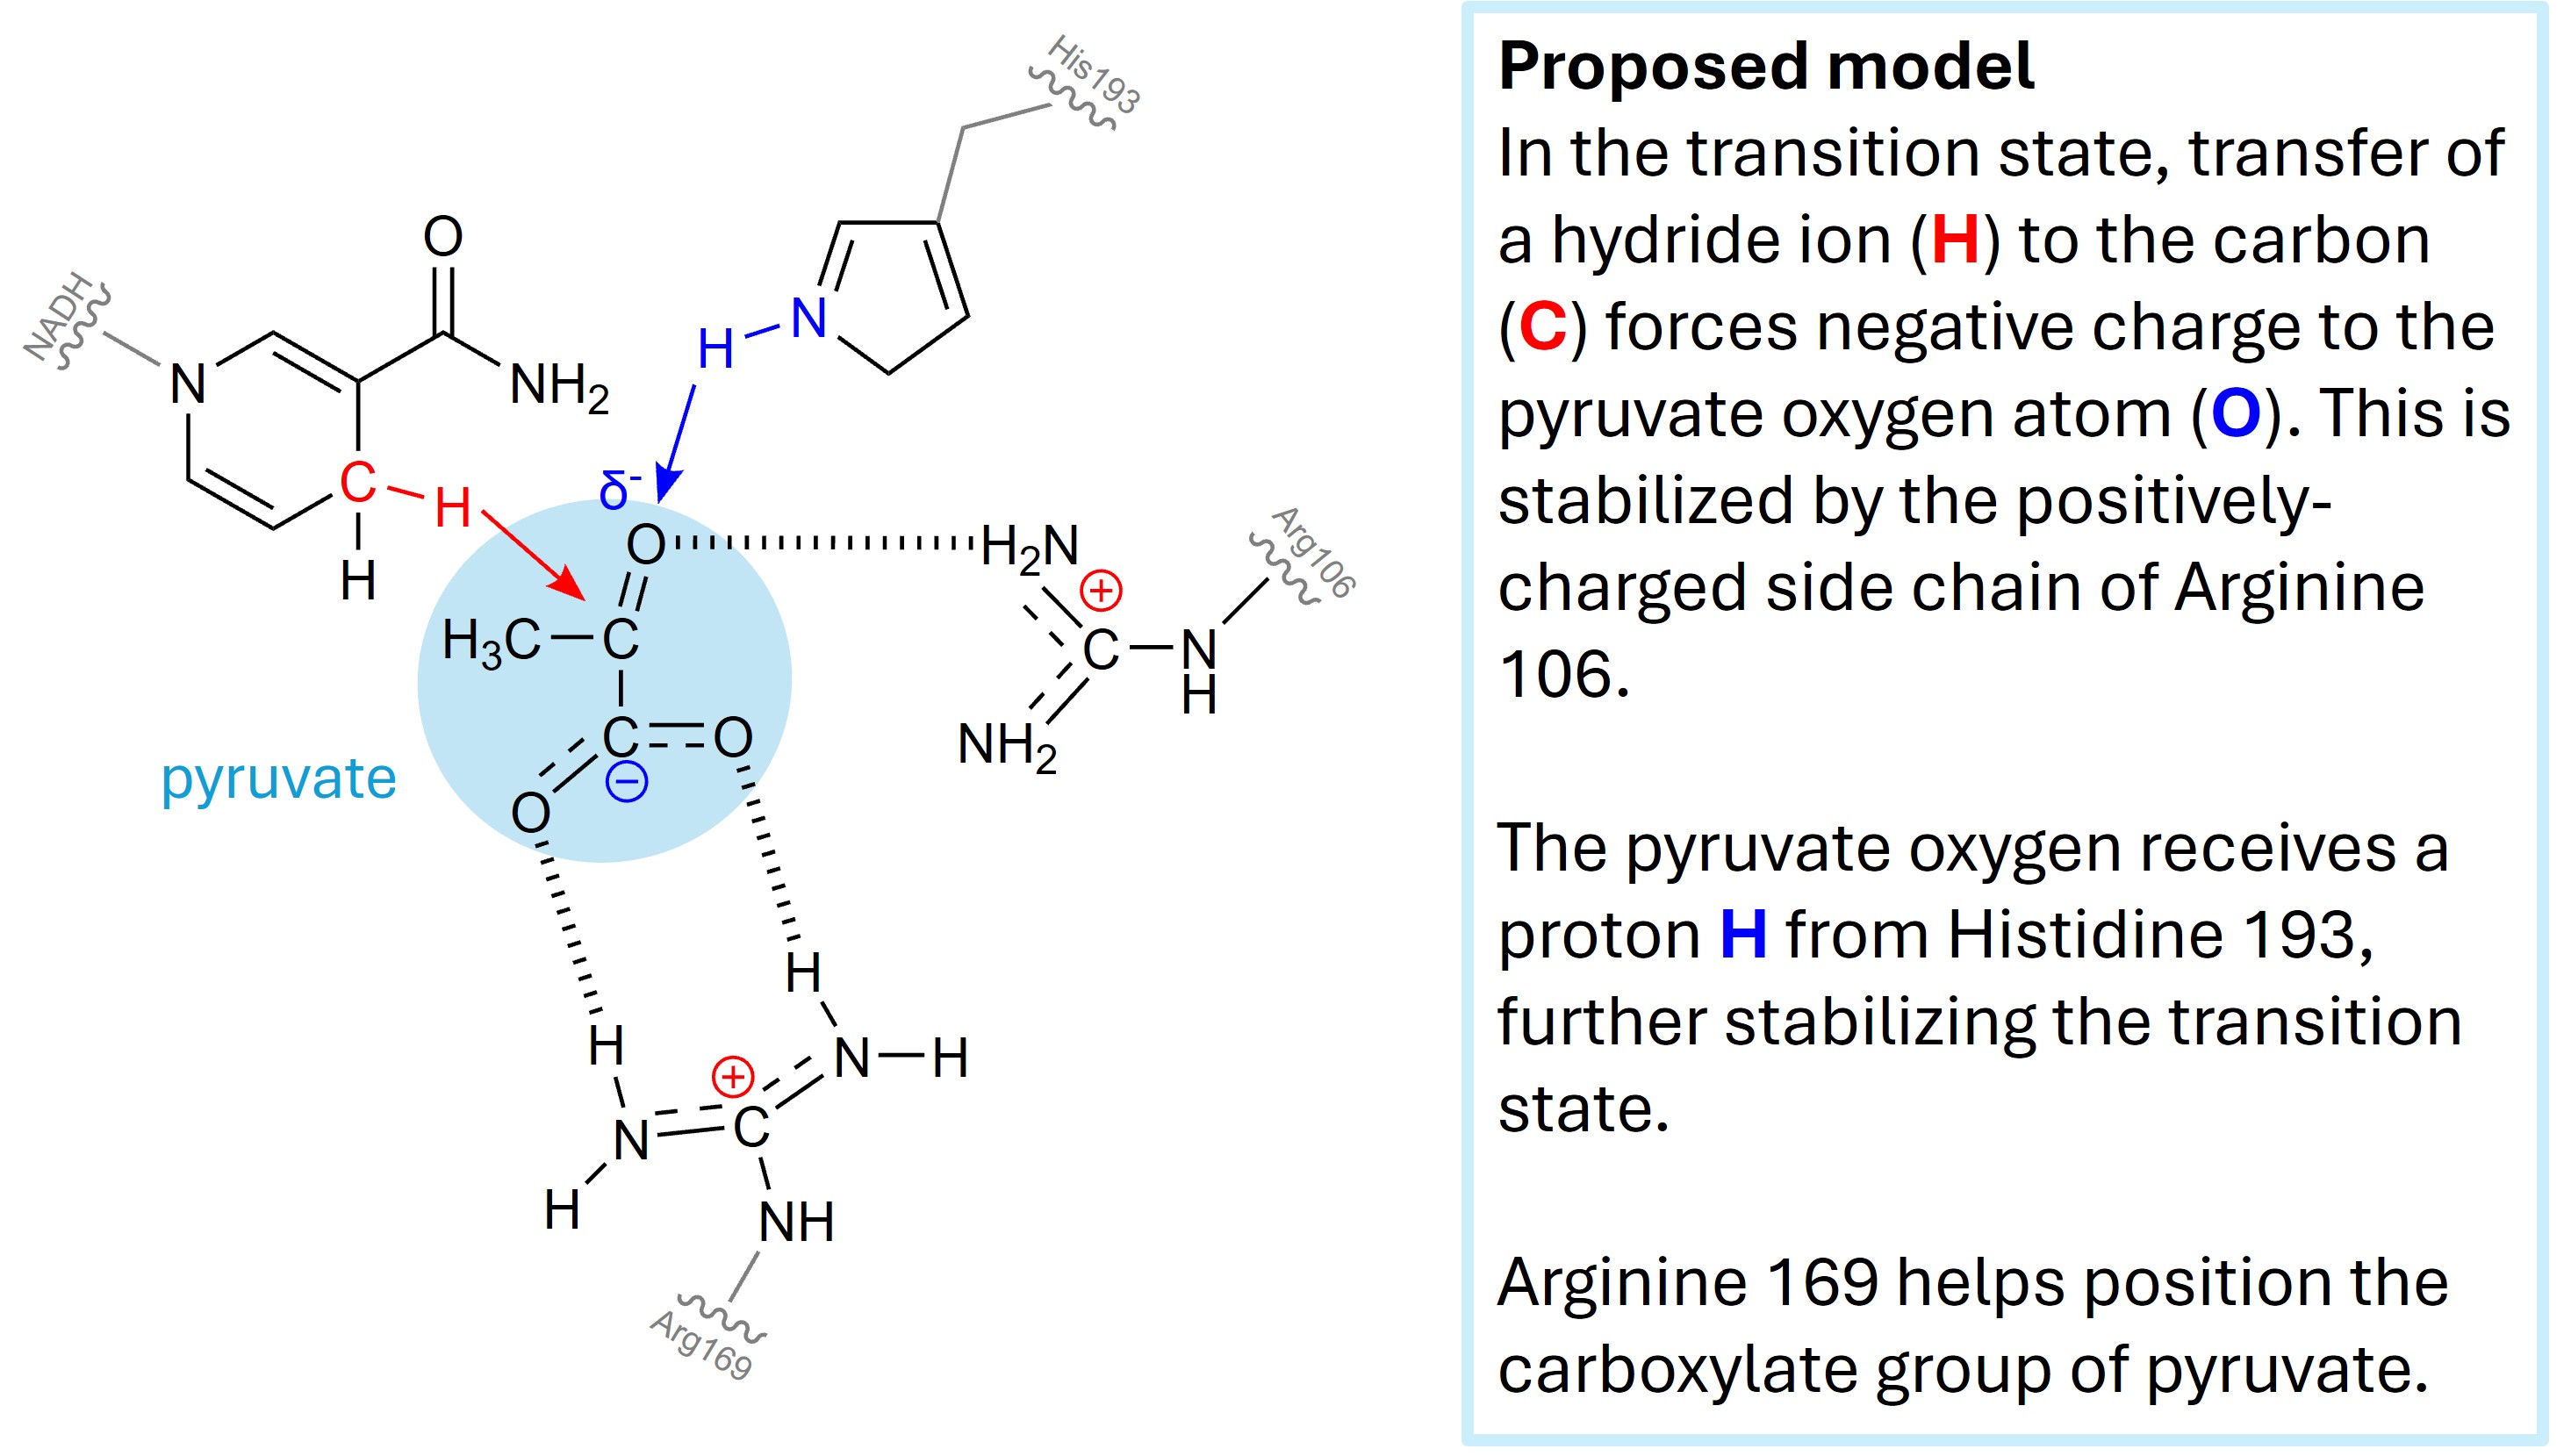
Fig. 3.8 Schematic of active site of lactate dehydrogenase, depicted in Fig. 3.8, catalyzing reaction shown in Fig. 3.4. Negative charge of the intermediate shown in Fig. 3.5 is stabilized [3].#
The active site of lactate dehydrogenase is composed by amino acids that are not next to each other in the amino acid chain, as it is the case for most active site of enzymes. Fig. 3.6 shows how the active site residues close in the folded enzyme (upper panel, yellow) is actually very far apart in the amino acid sequence (lower panel, yellow). The specificity of the enzymes is given by the shape of their active sites, which are structured to accept and accommodate certain substrates and not others. Most compounds that are not substrates do not fit in the active site and are excluded from it.
The lactate hydrogenase case study highlights how atoms belonging to the residue side chain atoms are precisely aligned to stabilize the transition state of the reaction via electrostatic interactions, proton donation, and many other interactions. Note that atoms in the enzyme backbone (specifically, the oxygen and amide N-H groups), often contribute hydrogen bonds and dipole moments to substrate binding and transition state stabilization.
3.5. How the active site works in catalysis#
Often, atoms or molecules that are not part of an amino acid residue are used to stabilize the transition state. These are called cofactors. Positively-charged metal ions are very often used to stabilize negative charged intermediates or transition states. It is very common to find magnesium, calcium, iron, manganese, nickel, zinc, in active sites, and these are often essential for enzyme activity. In the vast majority of enzymes, the catalysis in the active sites is supported by metal ion(s) and/or side chains/backbone atoms of amino acid residues.
3.5.1. Metal ions#
The enzyme enolase catalyzes conversion of 2-phosphoglycerate in phosphoenolpyruvate, with loss of 1 molecule of water (a dehydration reaction):
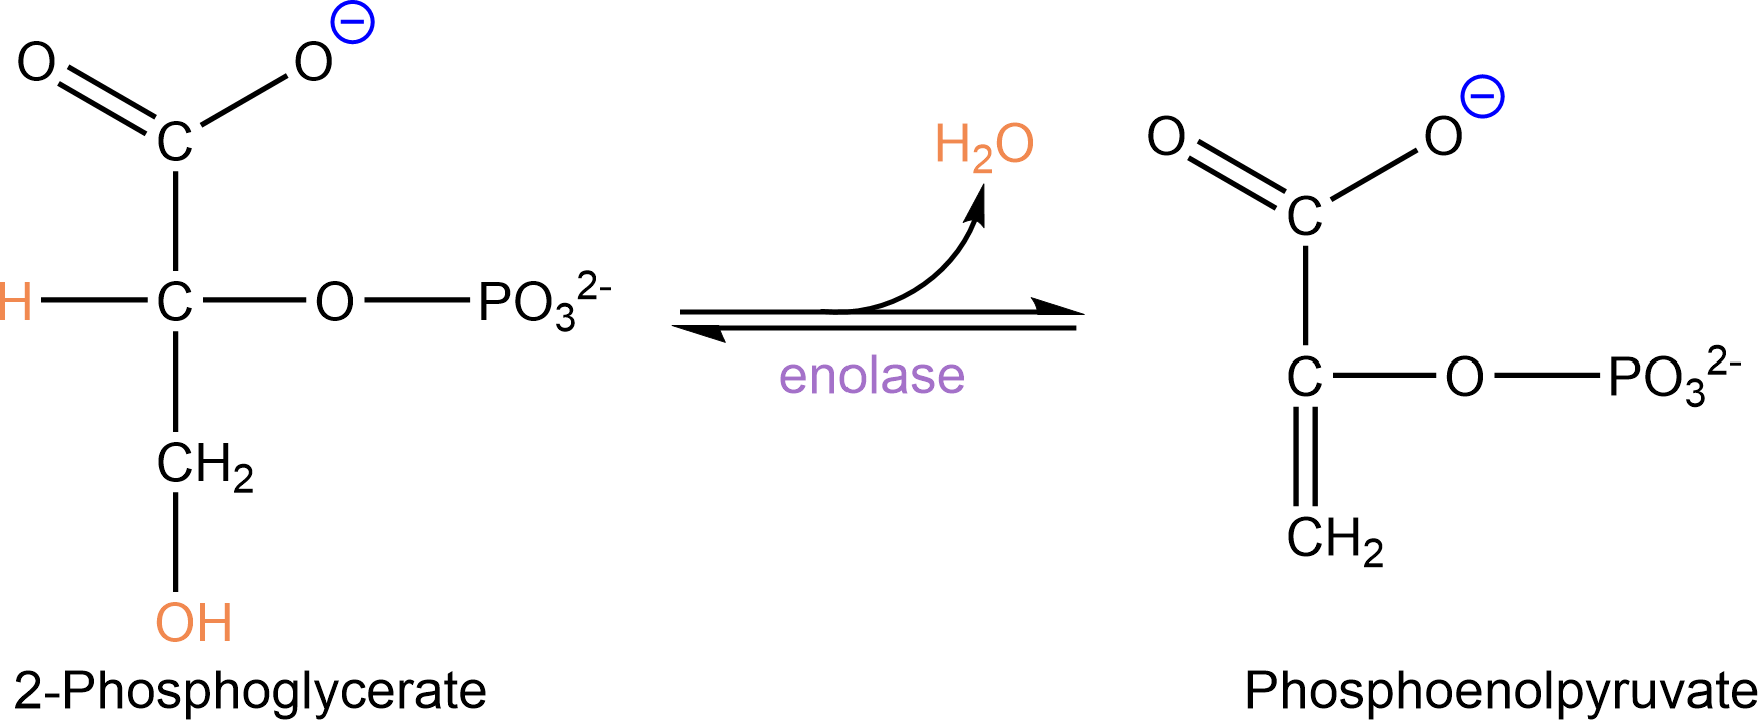
Fig. 3.9 Enolase reaction.#
In this case, two positively-charged Mg2+ ions stabilize the charges arising from two negatively charged oxygen atoms in the phosphoglycerate molecule:
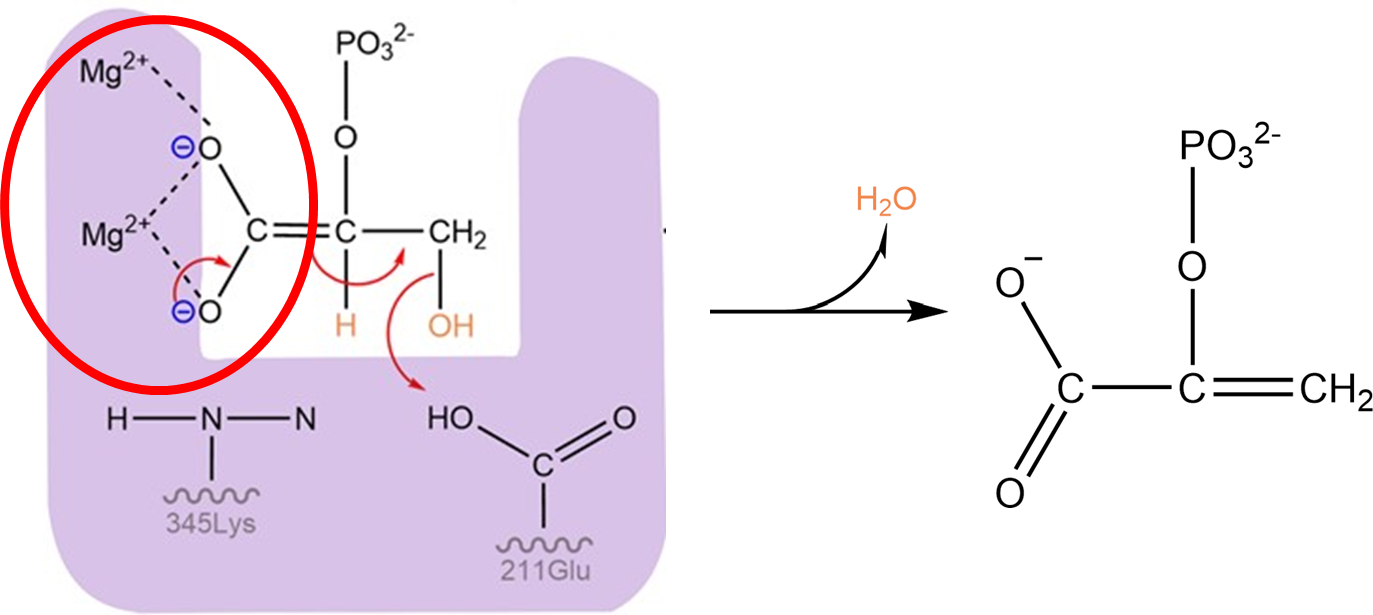
Fig. 3.10 Two magnesium ions are part of the active site of enzyme enolase, and stabilize the negative charges of the high energy intermediate of the enolase reaction.#
3.5.2. Amino acid residues can both donate and accept protons#
Amino acid side chains (and backbones!) can participate in stabilization of the transition state by weak interaction, but also by donating or accepting protons, as in the example below, the enolase reaction depicted in Fig. 3.11.
The enolate reaction removes water (H2O) from 2-phosphoglycerate in two steps: specifically, a proton is removed (H+) followed by a hydroxyl group (OH-).
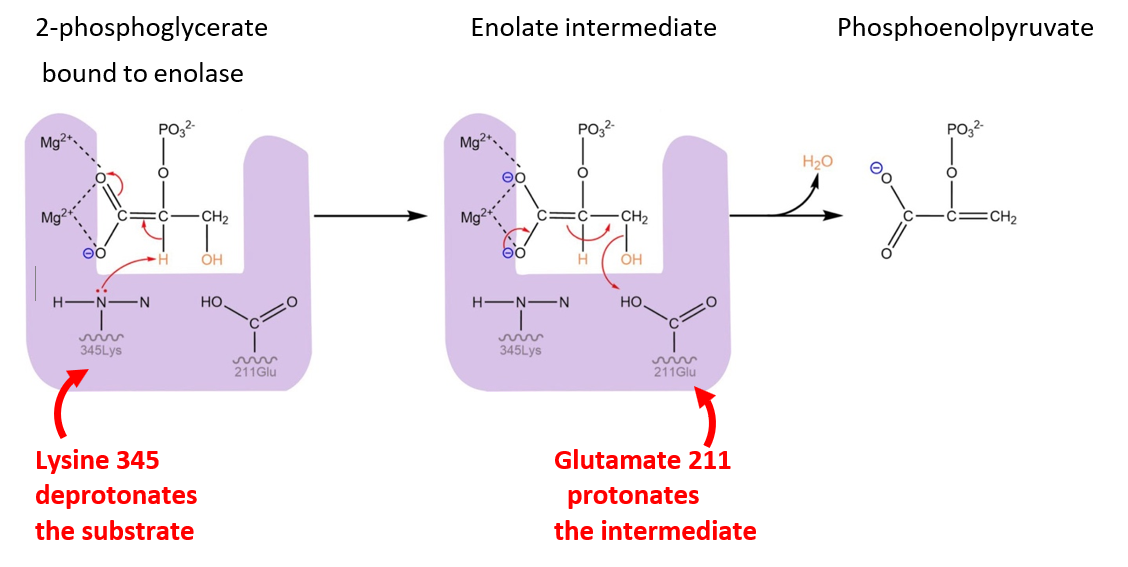
Fig. 3.11 Side chains of aminoacids within the active site promote the reaction by i. promoting formation of the intermediate (left) and facilitating reaction progression by ii. orienting the intermediate in a favourable position to accept the proton and form a new covalent bond (right).#
In the first step of the reaction scheme, the proton is removed by the side chain of lysine 345 (specifically, the nitrogen atom). As a later step in the reaction, glutamate 211 donates a proton to the hydroxyl group, allowing the OH- to dissociate from the substrate as H2O and form a C=C double bond.
The precise placement of side chains that are able to transport protons to and from the substrate accelerates the reaction. In the absence of these side chains, the proton transfers would require water molecules transiting into the active site at the same time as the substrate.
The example in Fig. 3.11 highlights how enzymes can be sensitive to the pH of the solution. In order for lysine 345 to deprotonate the substrate, the amino side chain (R-NH2) will need to be deprotonated before it can accept a proton from the substrate. If the lysine amino group is protonated (R-NH3+), it cannot accept an additional proton and instead becomes a proton donor. Lysines are more likely to be in a deprotonated state as the pH increases towards its pKa (i.e. pKa = 10.67 for free lysine, which will change slightly depending on the local environment within the active site). Conversely, glutamate 211 will only be available to donate a proton if its carboxyl group is protonated, with likelihood of protonation increasing at pH closer to its pKa (for free glutamate, pKa = 4.15, which will change slightly depending on the local environment within the active site). Because the enzyme requires lysine to be deprotonated while glutamate is protonated, the reaction will be most likely to occur around pH 7: higher pH will reduce the amount of protonated glutamate, while lower pH will reduce the amount of deprotonated lysine. Fig. 3.12 exemplifies dependence of lactate dehydrogenase reaction from protonation state of these glutamic acid and lysine residues.
NEED TO KNOW
Enzyme activity is sensitive to external pH values. As protonation state of the residues involves will affect which weak interactions the residues will be able to establish with the substrate and the intermediate state, each enzyme will work best within a defined pH values range, depending on the residues involved, their position in the structure, and their role in the catalysis mechanism, up to a pH optimum.
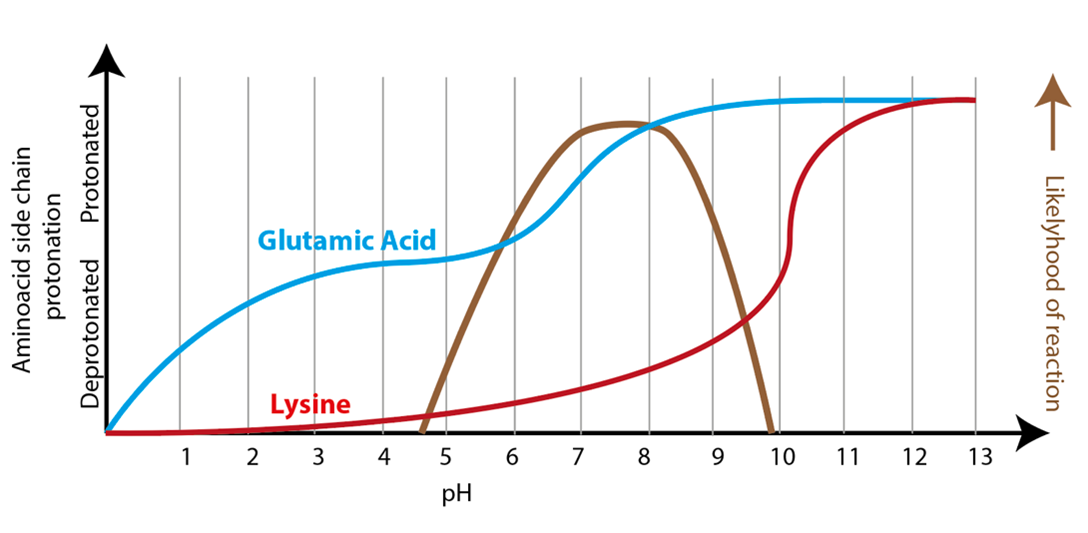
Fig. 3.12 An enzyme reaction rate will be affected by pH, and will work at optimum rate if the solution pH equals the optimum pH for the enzyme. In Figure: rate of lactate dehydrogenase reaction (brown) catalyzed by enzyme will be at its maximum if the pH of the solution is such to ensure that lysine will be deprotonated (red) while glutamic acid will be protonated (blue), as protonation state of these residues affects the ability of the enzyme to stabilize transition state. From 10.7: The Effect of pH on Enzyme Kinetics, shared under a CC BY-NC-SA 4.0 license.#
The enolase reaction shown above raises a question about what structure the enzyme is optimized to accommodate: is active site shaped to form stabilizing interaction preferentially with substrate, or with transition state?
To think about this question, try imagining a reaction that converts triangles to squares via an unstable trapezoid transition state. Now imagine two enzymes: one enzyme (red in the figure) forms more stabilizing weak interactions with the substrate than with the transition state, whereas the second enzyme (green) forms more stabilizing weak interactions with the transition state. Which will be a better catalyst?
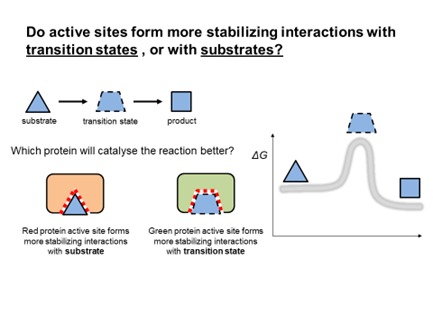
Fig. 3.13 A hypothetical trianglase reaction converts triangles to squares via an unstable trapezoidal intermediate.#
The answer can be depicted using energy diagrams. The red enzyme will tend to stabilize the substrate more than the transition state. This will increase the relative free energy between the substrate and the transition state, which will decrease the reaction rate. On the other hand, the green enzyme will decrease the relative free energy between the substrate and the transition state (by forming more stabilizing interactions with the transition state). This will increase the reaction rate.
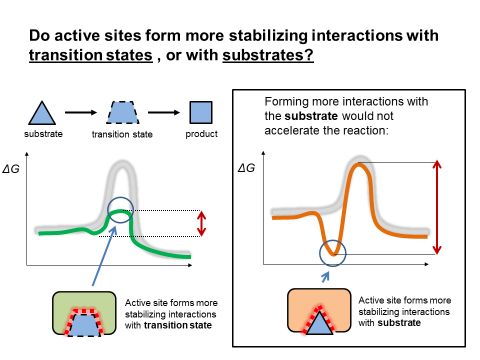
Fig. 3.14 Energy diagrams for enzymes complementary to the reactants or complementary to the transition state.#
3.6. Understanding catalysis kinetics with the Michaelis-Menten equation#
Let’s dive into how an enzyme kinetics can be quantified, and what parameters best describe the reaction. The key to thinking about enzyme kinetics is that catalysis requires the substrate to first bind the enzyme active site. This step which forms the enzyme-substrate complex.
Once the enzyme-substrate complex is formed, either the enzyme can release the substrate back into the solution, with no reaction occurring, or the reaction can be catalyzed, in which case the substrate is converted to product and the product is released from the active site. However, when the substrate is bound to the enzyme, an additional substrate cannot bind to the same space within the active site that is occupied by the substrate – at least, not until the substrate is either released or converted to product.
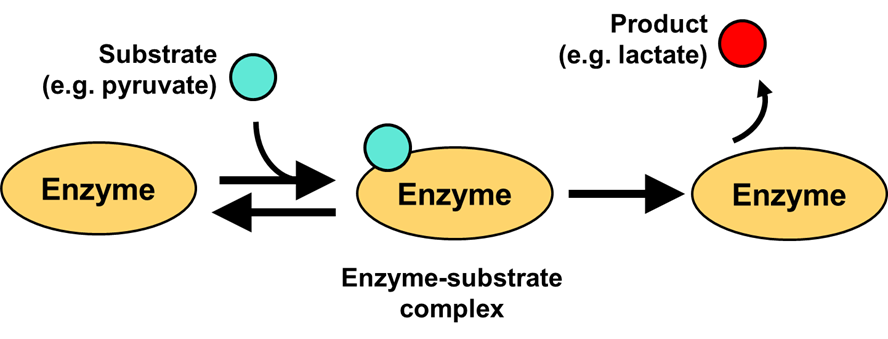
Fig. 3.15 Michaelis-Menten reaction scheme of a one-substrate enzyme.#
If we write out the chemical equation that expresses this scheme, we get Equation (3.2):
where \(E\) and \(S\) are substrates, \(ES\) is the enzyme-substrate complex, and \(P\) is the product. The lower-case \(k\) values are rate constants: \(k_1\) is the rate of enzyme-substrate binding (expressed in units of M-1s-1), \(k_{-1}\) is the rate of substrate release from the enzyme-substrate complex to form free enzyme and free substrate, and \(k_2\) is the rate of product formation from the enzyme-substrate complex.
In 1913, Maude Menten and Leonor Michaelis propose a mathematical model of enzyme kinetics with data obtained using the enzyme invertase, which hydrolyzes the sugar sucrose into monosaccharides fructose and glucose:
If we initiate a reaction by mixing 0.5 mM sucrose with invertase, and plot concentration of one of the products (e.g. glucose) versus time, we would obtain the blue curve depicted in Fig. 3.16:
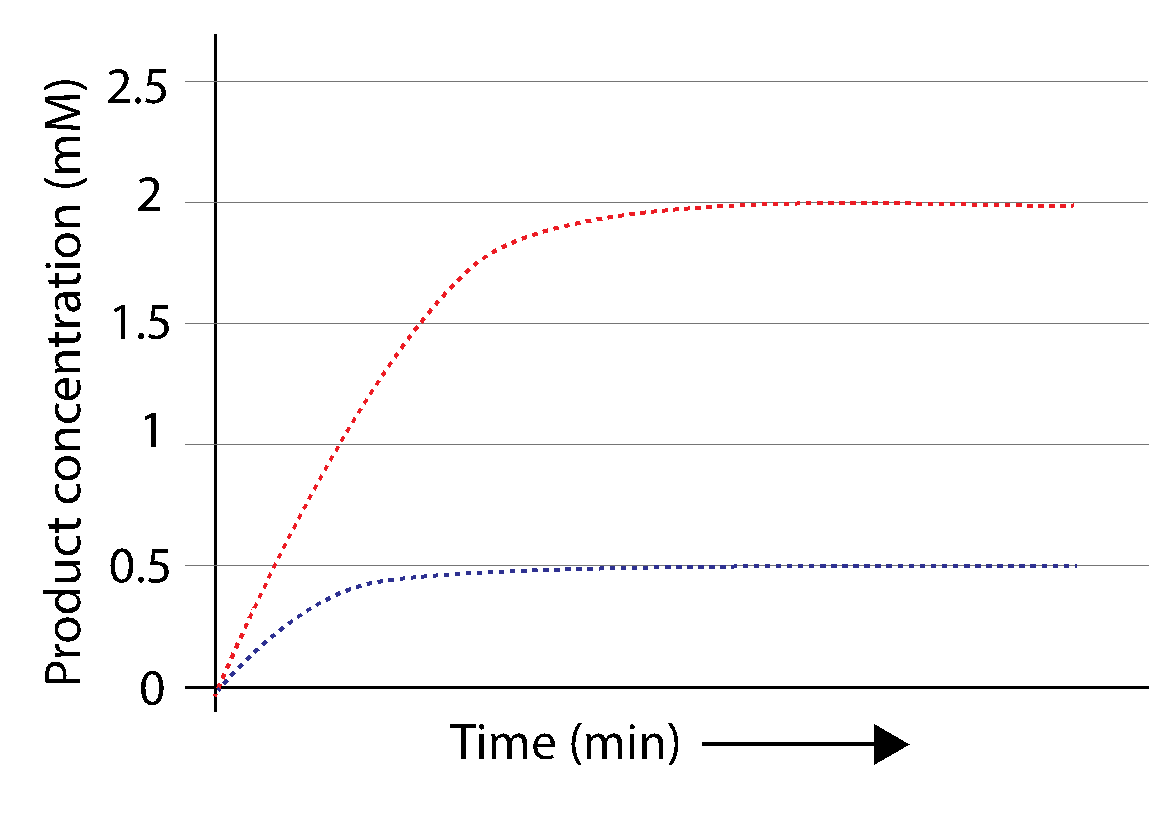
Fig. 3.16 As a result of an enzymatic catalysis, products accumulates over time (blue dotted line). Increasing initial substrate concentration 4 fold while keeping total enzyme concentration steady speeds up the reaction (red dotted line). If the initial amount of substrate is not topped up as the reaction proceeds, the substrate will be used up and the reaction will stop.#
After the reaction initiates (at time 0, where the y- and x-axes cross), the product rapidly accumulates, but the rate of accumulation steadily decreases until the final product concentration is reached. If we repeated the experiment with a 4-fold higher concentration of sucrose (2 mM instead of 0.5 mM), and plotted the concentration of product, we would get the dashed line depicted above in red.
Fig. 3.17 helps us visualize how the reaction velocity is dependent on the substrate concentration. The rate of product formation is faster when more substrate is present (more product is produced in the same unit of time). The reaction velocity (amount of product formed per unit time) can be quantified from the curves by obtaining a linear fit to the first few time points as depicted in Fig. 3.17:
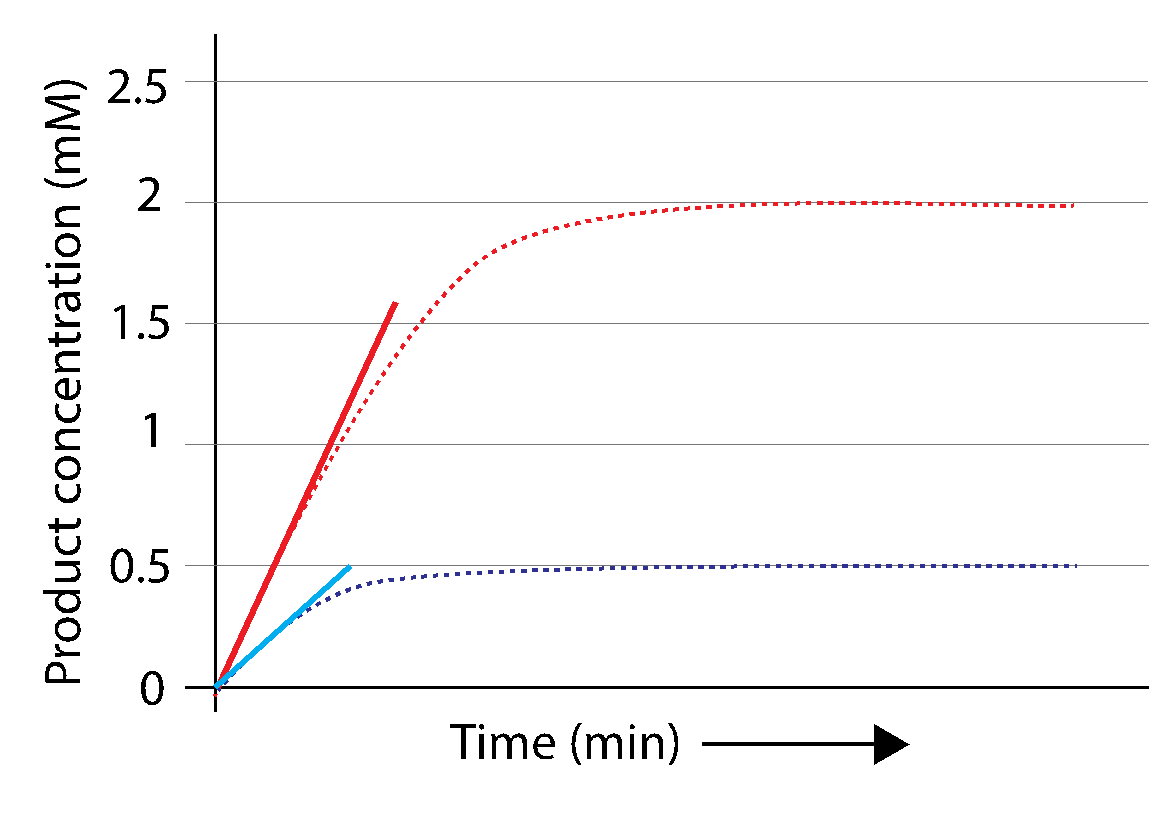
Fig. 3.17 The slope of the linear fit to the first data point of the reaction is the initial velocity \(V_0\) of the reaction (Thick blue and red lines, see Fig. 3.15). \(V_0\) will depend on initial substrate concentration.#
The initial velocity of an enzyme-catalyzed reaction can be increased by adding more substrate S. \(V_0\) is therefore dependent on substrate concentration. (The fact that the reaction velocity steadily decreases as the reaction proceeds is a consequence of the substrate being depleted from the reaction, which also reflects the dependence of the reaction velocity on substrate concentration.)
Importantly, the reaction velocity will not increase indefinitely when we keep increasing the substrate concentration:

Fig. 3.18 Product production monitoring of the invertase reaction, shown in Fig. 3.15, producing glucose from sucrose. To increasing concentrations of substrate beyond saturation does not correspond proportional increase in initial velocity.#
Doubling the sucrose concentration almost doubles the initial velocity of the reaction for low concentrations, but doubling the sucrose at high concentration increases the reaction velocity only slightly. So increasing the concentration of substrate used to initiate the reaction exerts diminishing effects on reaction velocity. Why does this happen?
This question prompted Menten to derive an equation that would describe the initial reaction rate (\(V_0\)) as a function of the substrate concentration used to initiate the reaction.
To understand why, let’s look at the step that forms product from the enzyme-substrate complex:
or:
It will become evident that the concentration of the enzyme-substrate complex affects the rate of formation of product: the more \(ES\) present, the more \(P\) will form at a rate \(k_2[ES]\). The rate \(V_0\) of \(P\) production is proportional to the concentration of \(ES\), therefore:
While the concentration of \(ES\) determines the reaction rate in a straightforward way, the concentration of enzyme-substrate complex is often not possible to experimentally measure or to directly control. The ultimate aim is to understand the dependency of \(V_0\) on \([S]\), which we can directly control by changing the amount of sucrose we use to start the reaction by mixing with the invertase enzyme. To determine the concentration of \([ES]\) given a known concentration of \([S]\), we start by accounting for the concentration of \(E\) (free enzyme). Although we can measure the concentration of \(E\) before adding the substrate, we cannot measure \(E\) directly after mixing sucrose with invertase, because some fraction of the free invertase \(E\) will bind sucrose and form the enzyme-substrate complex, \(ES\). However, the total concentration of invertase in solution \(E_T\) (free enzyme plus enzyme bound in enzyme-substrate complexes) will not change. This conservation can be expressed as:
Now we apply the steady-state assumption, which allows us to use chemical kinetics to calculate the steady-state concentration of \(ES\). The steady-state concentration is simply the rate of \(ES\) formation (from \(E\) and \(S\)) divided by the rate of \(ES\) breakdown, which can go either back to \(E\) and \(S\), or to create product, which generates \(E\) and \(P\).
The rate of \(ES\) formation is described by the first half of Equation (3.2):
and the rate of \(ES\) formation from \(E\) and \(S\) is simply the product of \(E\) and \(S\) concentrations multiplied by \(k_1\):
The rate of ES breakdown is the sum the rate of substrate release \(([ES]k_{-1})\) and the rate of product formation \(([ES]k_2)\).
If we apply the steady-state assumption, which are conditions in which total \(ES\) concentration does not change (i.e. \(ES\) breakdown is balanced by \(ES\) formation), we can set the two rates to be equal:
Such that:
Which, solved for \(ES\), becomes:
The rate constants \(k_1\), \(k_{-1}\), and \(k_{-2}\) determine the Michaelis constant:
Equation (3.5) allows to rewrite equation (3.3) as follows:
Equation (3.6) is the Michaelis-Menten equation, the fundamental equation in enzyme kinetics which describes the initial reaction rate \(V_0\) as a function of substrate concentration \([S]\):
Using the Michaelis-Menten equation to plot \(V_0\) as a function of \([S]\) will result in the following curve:
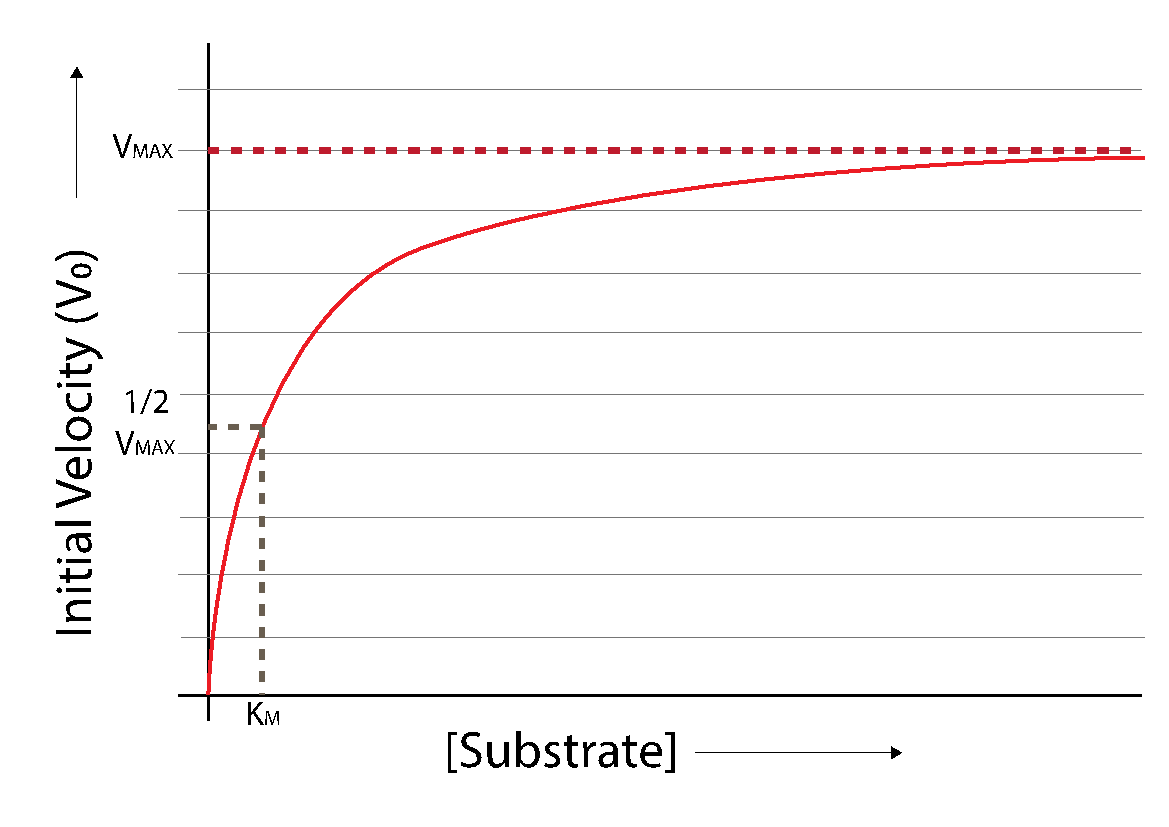
Fig. 3.19 Michaelis-Menten function (red).#
GOOD TO KNOW
3.7. Learning about enzymes from the Michaelis Menten Equation#
Fig. 3.19 depicts interesting features of enzymes as catalysts. The Michaelis-Menten function shows how reaction velocity increases with increasing substrate concentration, but that the degree to which the rate increases with substrate diminishes. The theoretical maximum velocity when \(S = \infty\) (an impossible concentration) is defined as \(V_{\text{max}}\). The velocity of an enzyme-catalyzed reaction can be increased by adding more \(S\); yet, as from Fig. 3.18 and Fig. 3.19, the production rate \(V_0\) will not continue to increase indefinitely with the substrate concentration, but will asymptotically approach a finite \(V_{\text{max}}\).
Why can’t the reaction rate not increase indefinitely with \([S]\)?
3.7.1. \(V_\text{max}\): Theoretical maximum reaction rate at infinite substrate concentration#
\(V_\text{max}\) is the theoretical maximum \(V_0\) for a given enzyme concentration \([E_T]\), and is achievable if \(S = \infty\) (as the \(\lbrack S\rbrack/(\lbrack S\rbrack + K_M)\) term would equal 1). Therefore:
Which allows to rewrite the Michaelis-Menten Equation, equation (3.6), into either:
The \(V_\text{max}\) term can be used when the total enzyme concentration is unknown. To determine \(k_2\), it is necessary to quantify the total enzyme concentration.
3.7.2. \(K_M\): the Michaelis constant#
Equation (3.7) defines \(K_M\) as a substrate concentration. In fact, when
then the (\([S]\)/(\([S]\)+\(K_M\))) term in Equation (3.7) becomes (\(K_M\)/(\(K_M\) + \(K_M\))) and so:
Equation (3.5) shows how the Michaelis constant is determined by the rate constants \(k_1\), \(k_{-1}\), and \(k_2\). These microscopic rate constants are independent of substrate and enzyme concentrations, and therefore, \(K_M\) is also independent of enzyme and substrate concentrations. An enzyme-substrate pair has a specific \(K_M\) value.
NEED TO KNOW
\(K_M\) is the substrate concentration at which the enzyme achieves half- maximum velocity (\(V_0 = 0.5 V_\text{max}\)). The Michaelis constant \(K_M\) is a feature of each specific enzyme-substrate pair.
So-called promiscuous enzymes that catalyze reactions with alternative substrates will have \(K_M\) and \(k_\text{cat}\) values that will likely be different for each substrate.
3.7.3. \(k_\text{cat}\)#
The Michaelis Menten equation includes the rate of \(P\) production from \([ES]\) breakdown, as follows:
Therefore, once the ES complex is formed, \(k_2\) is the limiting rate for product formation. This is usually the case when the concentration of substrate is much higher than \(K_M\) (e.g. \([S] > 10K_M\)), which are conditions in which most of the enzymes in solution have bound substrates and have formed enzyme-substrate complexes. For this reason, it is also referred as \(k_\text{cat}\), or the catalytic constant (sometimes referred to as turnover number). For one-substrate reactions, like the invertase reaction in Fig. 3.15, \(k_\text{cat}\) and \(k_2\) are the same parameter. For reactions involving more substrates, \(k_2\) will refer to a different step in the enzyme catalysis scheme (see Chapter 4).
NEED TO KNOW
Regardless of reaction scheme, \(k_\text{cat}\) approximates the reaction rate per unit enzyme when [S] >> \(K_M\).
3.8. Enzymes in their biological context#
The catalytic efficiencies of natural enzymes can vary of several orders of magnitude, regardless of their evolutionary trajectory. What would we learn about enzymes if we compared the kinetic properties of \(\sim\)2000 of them?
Bar-Even et al. [4] compiled a distribution of nearly 2000 experimentally-determined \(k_\text{cat}\) values. The distribution illustrated that while most ES complexes tend to form product very quickly (\(k_\text{cat} = 1-100 / sec\)), very few could be categorized as extremely fast (\(k_\text{cat} \sim 105 / sec\)). Evidently, not all enzymes evolved to be as efficient as they could be. Why would only some enzymes have a \(k_\text{cat}\) of \(10^5\)? What does this suggest about the enzyme’s role in the cell?
Enzymes are meant to speed up reactions to a pace compatible with cellular metabolism. But this highlights how there is a key difference between speeding up a reaction to a maximum value, no matter what the cellular condition and environmental situation is; and speeding up a reaction only when needed, in appropriate response to stimuli or to environmental cues.
To take a step further in connecting enzyme kinetics with cell biology, look again at the Michaelis-Menten equation:
Parameters in this equation directly determine reaction rate, yet some of them are out the control of the cell: for example, substrate concentration, which includes substrate availability (in the cell, in the organelle, and in the microenvironment of the enzyme) and diffusivity (how fast the substrate can diffuse around in the cell, which is influenced by its size and surface charge). In order to tune the activity of an enzyme to adapt to environmental changes (e.g. when the cell needs to consume sucrose), a cell needs to focus on the parameters it does have control over (e.g. promote the invertase reaction and break down sucrose into glucose and fructose): the \(E_T\), the total amount of enzyme. If the cell perceives a need to switch on - or increase the rate of - a desired enzymatic reaction, it will respond by increasing the production of total enzyme \(E_T\).
GOOD TO KNOW
A cell will often respond to environmental cues to promote an enzymatic reaction, often received via signaling pathways, by increasing transcription and translation of the corresponding enzyme.
We have learned that not all enzymes evolved to be as efficient as they can be. It is therefore unsurprising that an increasing body of research in currently going towards improving catalytic efficiency of natural enzymes, to make products of interest faster (think of cheap pharmaceuticals, or environmentally and politically conscious biofuels). At the same time, we can greatly learn about enzyme catalysis from mutagenesis experiments, where putative key residues in the active site are mutated strategically to investigate their effect on the catalytic mechanism, and to generate dominant negative mutants - mutant with loss of function compared to the natural enzyme.
How would mutations in the protein affect enzyme catalysis?
Some examples of mutagenesis include
Changing a specific amino acid to others with different shape and/or charge
Changing a specific amino acid to others with different size or rotational freedom
Changing an amino acid to disrupt a weak bond with the substrate or with the transition state
Changing one or more amino acids to make the enzyme unable to bind a cofactor, such as a metal ion
In Chapter 3, we have explored the basic principles behind enzyme catalysis and reaction kinetics. In the next chapter, we will focus on enzyme regulation strategies that take place in the cell.
Jeffrey I Boucher, Joseph R Jacobowitz, Brian C Beckett, Scott Classen, and Douglas L Theobald. An atomic-resolution view of neofunctionalization in the evolution of apicomplexan lactate dehydrogenases. eLife, 3:e02304, 2014. doi:10.7554/eLife.02304.
D.H. Williams, E. Stephens, D.P. O’Brien, and M. Zhou. Understanding noncovalent interactions: ligand binding energy and catalytic efficiency from ligand-induced reductions in motion within receptors and enzymes. Angew Chem Int Ed Engl, 43:6596–616, 2004. doi:10.1002/anie.200300644.
Jean E. Masterson and Steven D. Schwartz. The enzymatic reaction catalyzed by lactate dehydrogenase exhibits one dominant reaction path. Chemical Physics, 442:132–136, 2014. doi:10.1016/j.chemphys.2014.02.018.
Arren Bar-Even, Elad Noor, Yonatan Savir, Wolfram Liebermeister, Dan Davidi, Dan S. Tawfik, and Ron Milo. The moderately efficient enzyme: evolutionary and physicochemical trends shaping enzyme parameters. Biochemistry, 50(21):4402–4410, 2011. doi:10.1021/bi2002289.