6. Animation inside a Jupyter notebook#
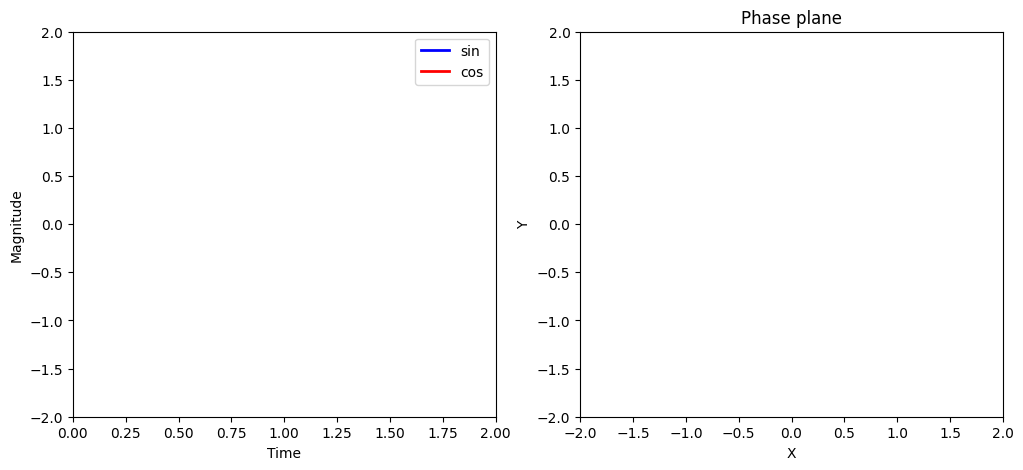
Next to (plain or enhanced) MarkDown, Jupyter books can also contain chapters which are essentially Jupyter Notebooks. The current file is an example, in which I’ve created an animation in a Jupyter Notebook, which plots the sine/cosine and their phase plane over time.
Source: colab Google
6.1. Step 1: Background frame#
%matplotlib inline
import numpy as np
import matplotlib.pyplot as plt
# Create a figure and axes.
fig = plt.figure(figsize=(12,5))
ax1 = plt.subplot(1,2,1)
ax2 = plt.subplot(1,2,2)
# Set up the subplots
ax1.set_xlim((0,2))
ax1.set_ylim((-2,2))
ax1.set_xlabel('Time')
ax1.set_ylabel('Magnitude')
ax2.set_xlim((-2,2))
ax2.set_ylim((-2,2))
ax2.set_xlabel('X')
ax2.set_ylabel('Y')
ax2.set_title('Phase plane')
# Create objects that will change in the animiation.
# These objects are initially empty, and will be given new values for each frame in the animation.
txt_title = ax1.set_title('')
line1, = ax1.plot([], [], 'b', lw=2) # ax.plot returns a list of 2D line objects.
line2, = ax1.plot([], [], 'r', lw=2)
pt1, = ax2.plot([], [], 'g.', ms=20)
line3, = ax2.plot([], [], 'y', lw=2)
ax1.legend(['sin', 'cos']);

6.2. Step 2: Define a function to draw each frame#
# Animation function. This function is called sequentially.
def drawframe(n):
x = np.linspace(0, 2, 1000)
y1 = np.sin(2 * np.pi * (x - 0.01 * n))
y2 = np.cos(2 * np.pi * (x - 0.01 * n))
line1.set_data(x, y1)
line2.set_data(x, y2)
line3.set_data(y1[0:50],y2[0:50])
pt1.set_data([y1[0]], [y2[0]]) # Note that matplotlib will throw an error if we supply only numbers (i.e., pt1.set_data(y1[0],y2[0]))
txt_title.set_text('Frame = {0:4d}'.format(n))
return (line1,line2)
# Initialization function.
def init():
line1.set_data([],[])
line2.set_data([],[])
return(line1, line2)
6.3. Step 3: Create the animation object#
from matplotlib import animation
#anim = animation.FuncAnimation(fig, drawframe, init_func=init, frames=100, interval=20, blit=True)
anim = animation.FuncAnimation(fig, drawframe, frames=100, interval=20, blit=True)
# blit = True re-draws only the parts that have changed.
6.4. Step 4 (JavaScript version)#
Use HTML(anim.to_jshtml()) See Stackoverflow inline animations in Jupyter. Note that this takes some time to parse.
from IPython.display import HTML
HTML(anim.to_jshtml())